1.3 Methods to probe the 3D chromatin architecture
1.3.1 Microscopy-based techniques to visualize the genome in 3D
Historically, the organization of chromosomes and specific loci within the nucleus have mostly been studied using fluorescent in situ hybridization (FISH) experiments. FISH is limited to visualize a few pre-defined loci in a few hundred cells at once and is limited in spatial resolution. Novel super-resolution microscopy approaches such as STORM and PALM have enabled direct visualization of the fine-scale structures of the genome at an unprecedented resolution (Bonev and Cavalli 2016). Labeling of specific chromatin proteins, histone marks, or genomic loci allow to analyze the dynamics of chromosomes at high resolution in living cells. However, despite spectacular technical progress, microscopy-based approaches are limited to a small number of genetic loci and do not allow a comprehensive analysis of the nuclear architecture of the complete genome. Furthermore, the specific folding patterns observed in microscopy cannot be mapped to genomic coordinates. This substantially limits the computational integration with other genomic data. However, a combination of imaging-based techniques with proximity-ligation experiments together with integrative computational models might enable to study the real-time dynamics of chromatin organization with high resolution on the single cell level (Stevens et al. 2017; Flyamer et al. 2017).
1.3.2 Proximity-ligation based method to quantify chromatin interactions
The frequency of interactions between different loci in the genome can be measured experimentally by proximity ligation techniques (Sati and Cavalli 2017; Schmitt et al. 2016). These protocols are variations of the chromosome conformation capture (3C) experiment (Dekker et al. 2002). 3C works by the ability to cross-link two genomic loci that are in close physical proximity in the nuclear space (Fig. 1.2A). This is achieved by treating cells with formaldehyde leading to covalent bonds between individual proteins and DNA with proteins (Hoffman et al. 2015). The cross-linked chromatin is then digested by restriction enzymes to fragment the genomic DNA. Then, re-ligation of fragmented DNA result in hybrid DNA molecules of restriction fragments that were in close physical proximity during cross-linking but originate from different regions in the linear genome sequence (Dekker et al. 2013; Andrey and Mundlos 2017).
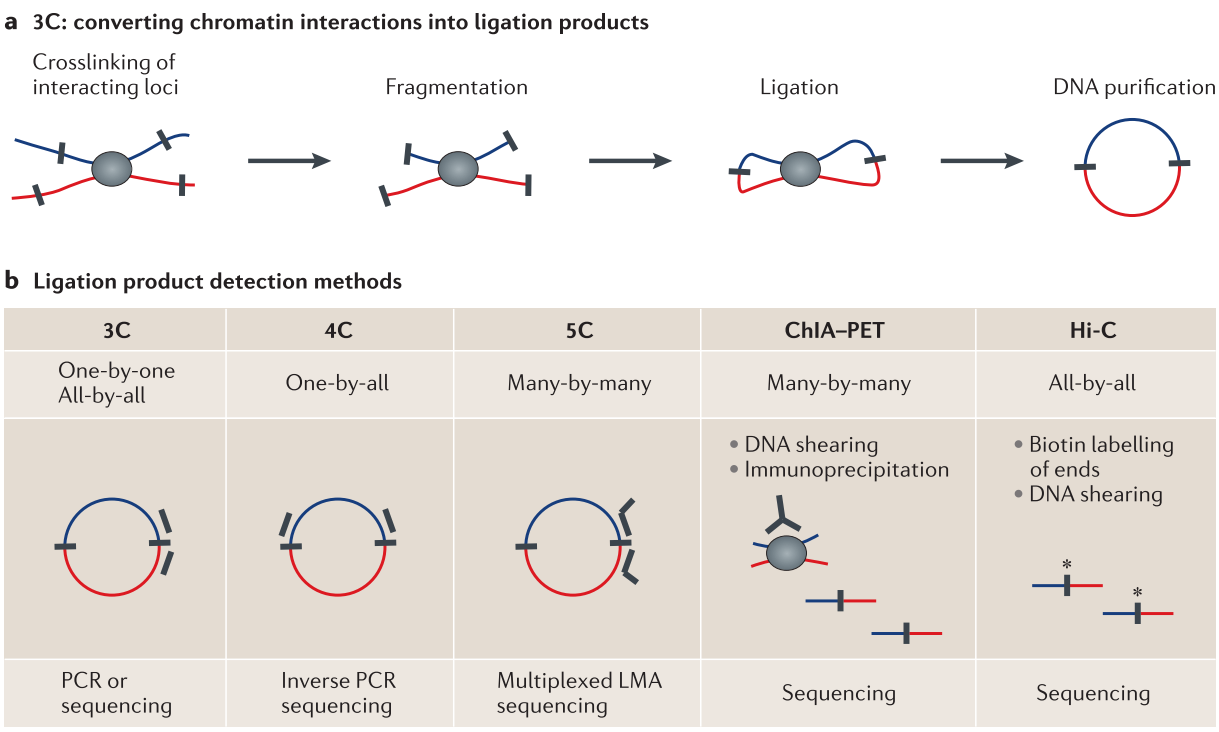
Figure 1.2: Proximity ligation technologies to measure chromatin interactions. (A) By treating cells with formaldehyde chromatin is crosslinked. After fragmentation with restriction enzymes, DNA from two loci in close physical proximity in the nucleus is ligated to a hybrid DNA molecule that is then made from DNA that originated from two regions distal in the linear genome (indicated in red and blue). (B) Different variants of the 3C experiments differ in their approaches to measure the ligation products or subsets of it, in order to quantify chromatin interactions. Figure adapted from (Dekker et al. 2013).
There exist several 3C-based methods which differ by the way the ligation product, which represents and chromatin interaction, is measured and quantified (Fig. 1.2B). The standard 3C protocol allows quantifying hybrid DNA-product by quantitative PCR using specific primers to amplify the product junction (Dekker et al. 2002). In Circular chromosome conformation capture (4C) experiments, a circular PCR is used to amplify all hybrid DNA products that are ligated with the desired restriction fragment, e.g., a specific viewpoint of interest. These products are then sequenced to generate an interaction profile measuring all interacting regions with this viewpoint (Simonis et al. 2006; Noordermeer et al. 2011). Another variant of 3C, Carbon copy chromosome conformation capture (5C), combines 3C with hybrid capture approaches to identify up to millions of interactions in parallel between two large sets of predefined loci, for example between a set of promoters and a set of distal regulatory elements (Dostie et al. 2006; Sanyal et al. 2012). Other methods combine chromatin immunoprecipitation to enrich for chromatin interactions between loci bound by specific proteins of interest or marked by post-translational histone modifications. One of these methods is chromatin interaction analysis by paired-end tag sequencing (ChIA-PET), which allows for genome-wide analysis of long-range interactions between sites bound by a protein of interest (Fullwood et al. 2009). Therefore, ChIA-PET data represent a selected subset of all interactions but is an efficient alternative to measure interactions at high resolution (Tang et al. 2015). The most unbiased method to quantify all pair-wise interactions genome-wide is Hi-C (Lieberman-Aiden et al. 2009). After the initial restriction enzyme step of 3C, in Hi-C, the ends are filled with a biotin-marked nucleotide and subsequently re-ligated. A streptavidin pull-down step enriches the chimeric products, which are then sequenced using paired-end sequencing technology. Each read from the resulting read-pairs is then aligned independently to the reference genome to identify the originating position of the sequenced restriction fragment. Each read pair represents a pairwise physical interaction of the corresponding regions. Interaction frequencies are usually analyzed by binning the genome into equal-sized regions of several kb depending on sequencing depth. While the first Hi-C study produced genome-wide interactions at a 1Mb resolution (Lieberman-Aiden et al. 2009), more recent studies could analyze folding patterns at 40kb (Dixon et al. 2012) and later up to 1kb resolution (Rao et al. 2014). These methods provided fascinating insights into higher-order genome organization.