2.3 Results
2.3.1 Distribution of paralog genes in the human genome
Paralogs are homologous genes that arise from gene duplication events. Their common ancestry and replicated sequence often leads to similar structure and function in related pathways and protein complexes. We therefore hypothesised that the transcription of paralogs should have a tendency for co-regulation, which could correspond to their position in the genome and within TADs. To test this hypothesis, we first focused on the positions of paralogs in the linear genome.
From all \(19,430\) protein coding genes in the human genome, \(13,690~(70.5\%)\) have at least one paralog (Fig. A.1A). However, many human genes have several paralogs (Fig. A.1B). From all \(46,546\) paralog gene pairs we filtered for only one pair per gene \((n=6,256)\) and further for non-overlapping pairs on the same chromosome \((n=1,560)\) (see ). We will refer to close paralogs if their transcription start sites (TSSs) are within 1 Mb of each other \((n=1,114)\) and to distal pairs for paralogs with TSSs separated by more than 1 Mb \((n=446)\) (Table 2.1).
We first compared basic properties between genes that have at least one paralog copy and genes without human paralogs. Paralogs have significantly larger gene length than non-paralog genes (\(p = 1.7 \times 10^{-53}\), Wilcoxon rank-sum test, Fig. A.1C), which fits the observation from (He and Zhang 2005) in yeast. Furthermore, paralogs tend to be associated to more enhancers compared to non-paralog genes (on average \(3.8\) vs. \(2.5\) enhancers per gene, \(p=2.89\times10^{-70}\), Fig. A.1D) and the distance to the nearest associated enhancer is significantly shorter (\(p=2.71\times10^{-22}\),Fig. A.1E).
Since most genome duplication events in humans emerge through tandem duplications (Newman et al. 2015), we expected some co-localization among pairs of paralog genes. Indeed \(24.9\%\) of paralog pairs are located on the same chromosome. We compared this to random expectation by sampling random gene pairs from all protein coding human genes and found only \(5.3\%\) of randomly sampled gene pairs on the same chromosome (\(p<10^{-16}\), Fig. 2.1A).
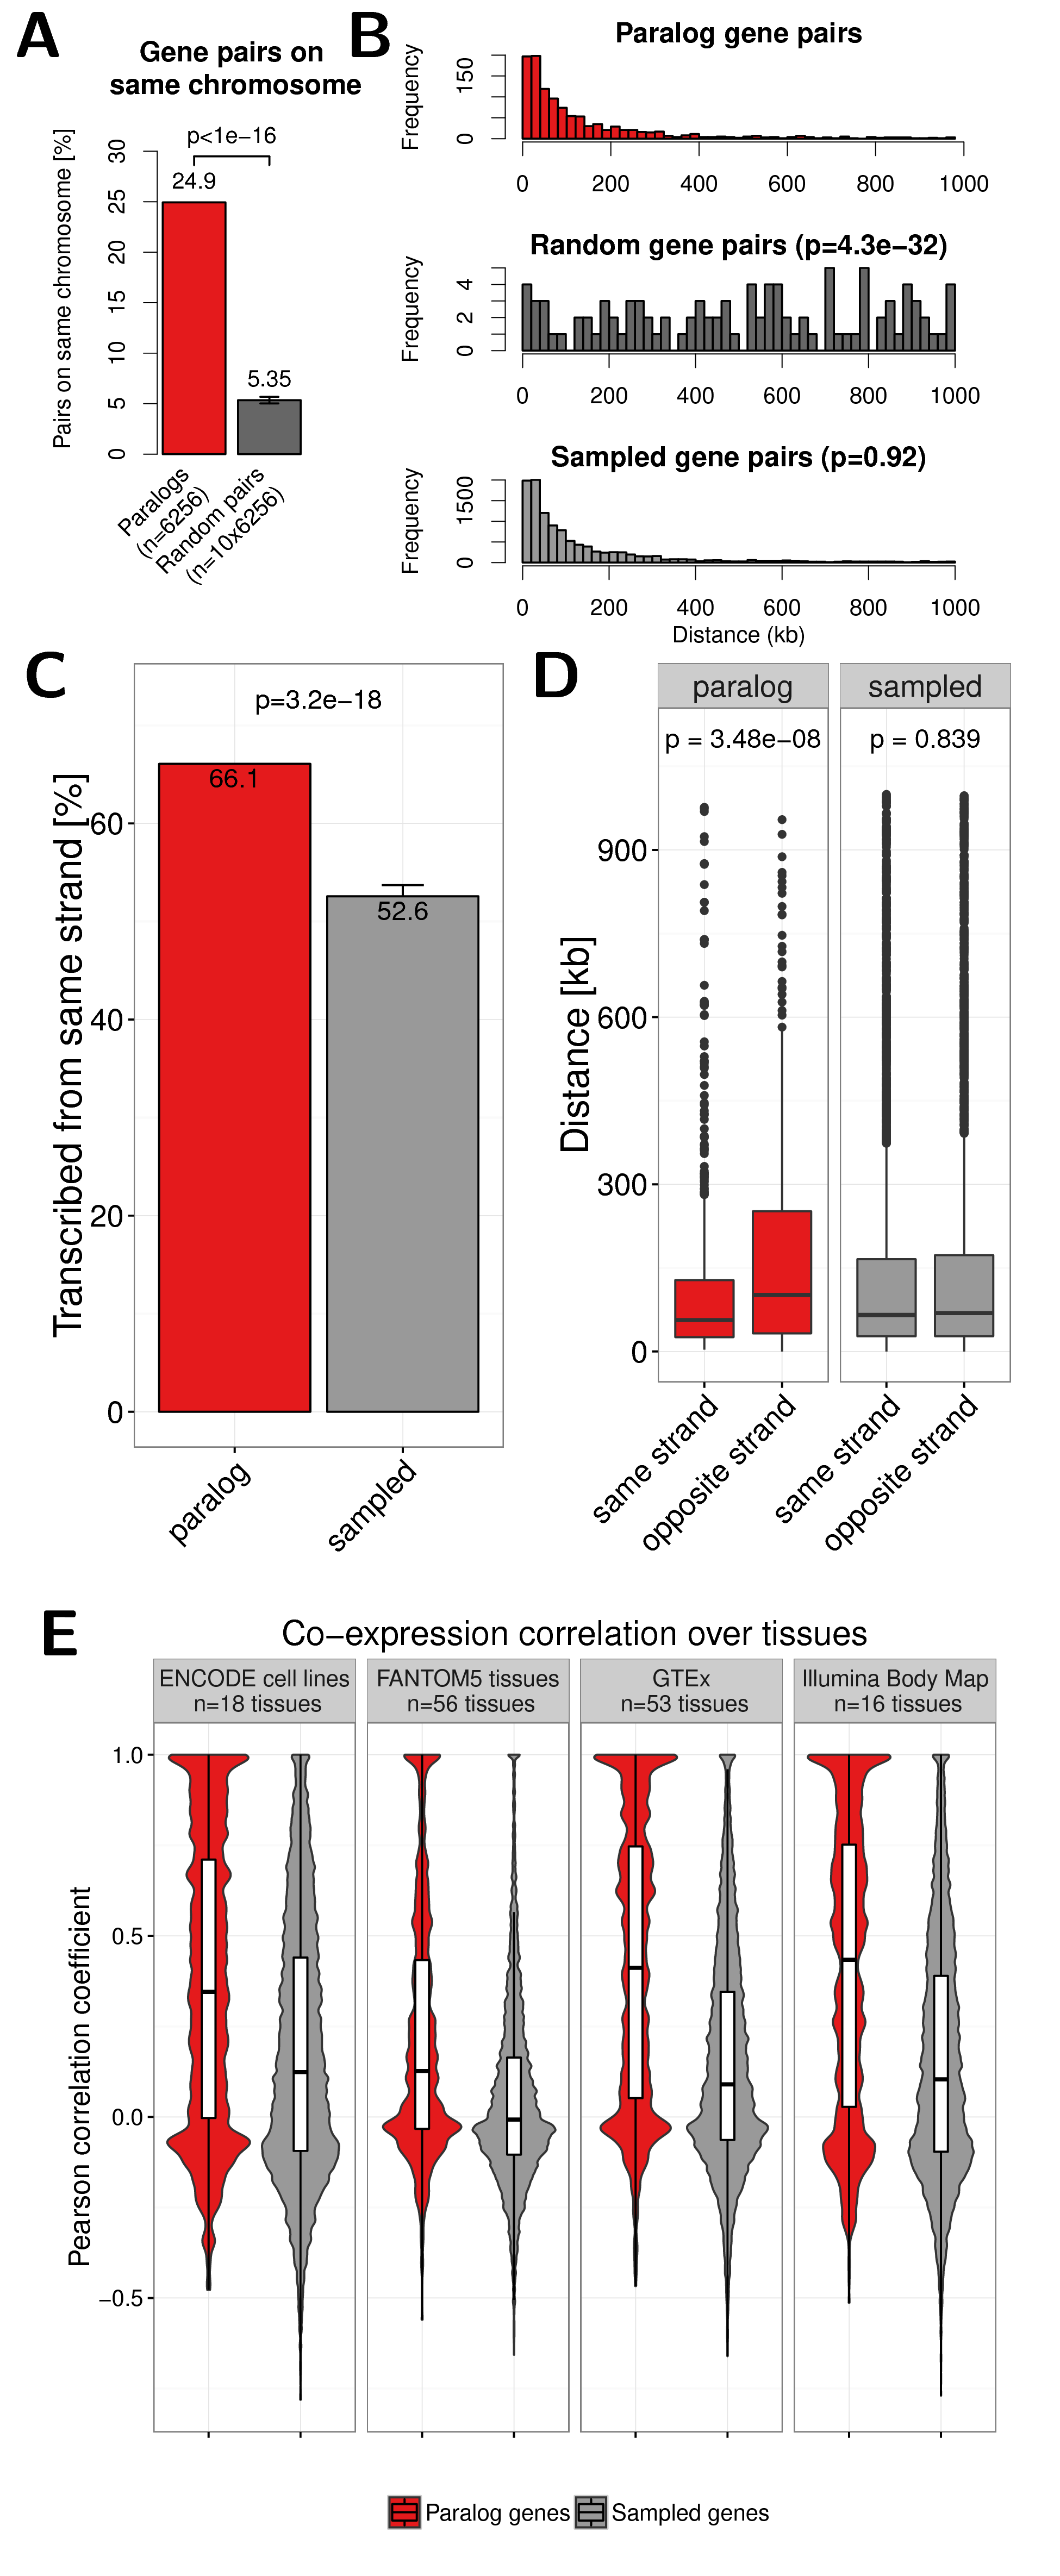
Figure 2.1: (A) Percent of paralog (red) and random (dark grey) gene pairs that are located on the same chromosome. The error bar indicates the standard deviation observed in 10 times replicated random sampling of gene pairs. (B) Genomic distance distribution of paralogs gene pairs (top), random gene pairs (center) and gene pairs sampled according to distance distribution of paralogs (bottom). Distances are measured in kilo base pairs (kb) between TSS of genes in pairs. P-values are calculated using Wilcoxon rank-sum test. (C) Percent of paralog (red) and sampled (grey) gene pairs that are transcribed from the same strand. Only pairs on the the same chromosome within 1 Mb are considered here. Error bars indicate the standard deviation observed in 10 times replicated sampling of gene pairs. (D) Boxplot of the genomic distance between paralogs and sampled gene pairs with the same or opposite strands. (E) Distribution of Pearson correlation coefficients of gene expression values in four independent data sets between paralog gene pairs (red) and sampled control gene pairs (grey). White boxes show 25th, 50th and 75th percent quantile of the data and the filled areas indicate the density distribution..
We further analysed whether paralog pairs tend to be located in close genomic distance on the same chromosomes. We compared the distance between paralog gene pairs to the distance of completely random genes on the same chromosome. As expected there is a strong bias of genomic co-localization among paralog gene pairs that is not observed for random gene pairs (\(p=4.3\times10^{-32}\), Fig 2.1B).
We also observed that close paralog genes show more often than expected the same transcription orientation. From all paralog pairs within 1 Mb on the same chromosome \(66.1\%\) have the same sense. This is significantly more than for randomly sampled genes with the same distance (52.6%, \(p=3.2\times10^{-18}\), Fig. 2.1C).
Furthermore, we observed that paralogs in the same strand are closer to each other on the chromosome than pairs in opposite strands (\(p=3.48\times10^{-8}\), Fig. 2.1D).
Together, this shows that paralogs tend to be located within short linear distance on the same chromosome and same transcription sense, which might enable coordinated regulation by shared regulatory mechanisms.
2.3.2 Co-expression of paralog gene pairs across tissues
To assess whether paralog genes tend to be indeed co-regulated we compared gene expression of paralog gene pairs over several human tissues and cell lines.
We compared the Pearson correlation coefficient (PCC) of gene expression values over \(n = 18\) cell-lines analysed by the ENCODE consortium by RNA-seq (Djebali et al. 2012). The distribution of PCC among paralog genes is bimodal with one peak around \(-0.1\) and another at nearly \(1.0\), which indicates that there exists a group of paralog pairs without expression correlation and that the expression of other paralogs is highly positively correlated. Notably, we did not find the latter signal for positive correlation in our control set of carefully sampled gene pairs (Fig. 2.1E).
We repeated the analysis with three other independent gene expression data sets form FANTOM5 (\(n=56\) tissues) (Forrest et al. 2014), GTEx (\(n=53\) tissues) (Ardlie et al. 2015) and the Illumina Body Map (\(n=16\) tissues), which we retrieved from the EBI Expression Atlas (Petryszak et al. 2015). In all data sets we found more positively correlated paralog pairs compared to the sampled gene pairs (Fig. 2.1E). This shows that many paralogs are expressed with high coordination in a tissue specific manner.
2.3.3 Paralog genes share enhancers
We hypothesised that common gene regulation of close paralog genes is likely to be facilitated by shared enhancer elements. Indeed we found that paralog gene pairs within 1 Mb on the same chromosome are associated to the same enhancer elements more often than expected by chance (Fig. 2.2). We estimated the expected background distribution of shared enhancers by carefully sampling gene pairs with the same distributions as paralogs in distances and associated enhancers to single genes (Fig. A.4, section 2.2).
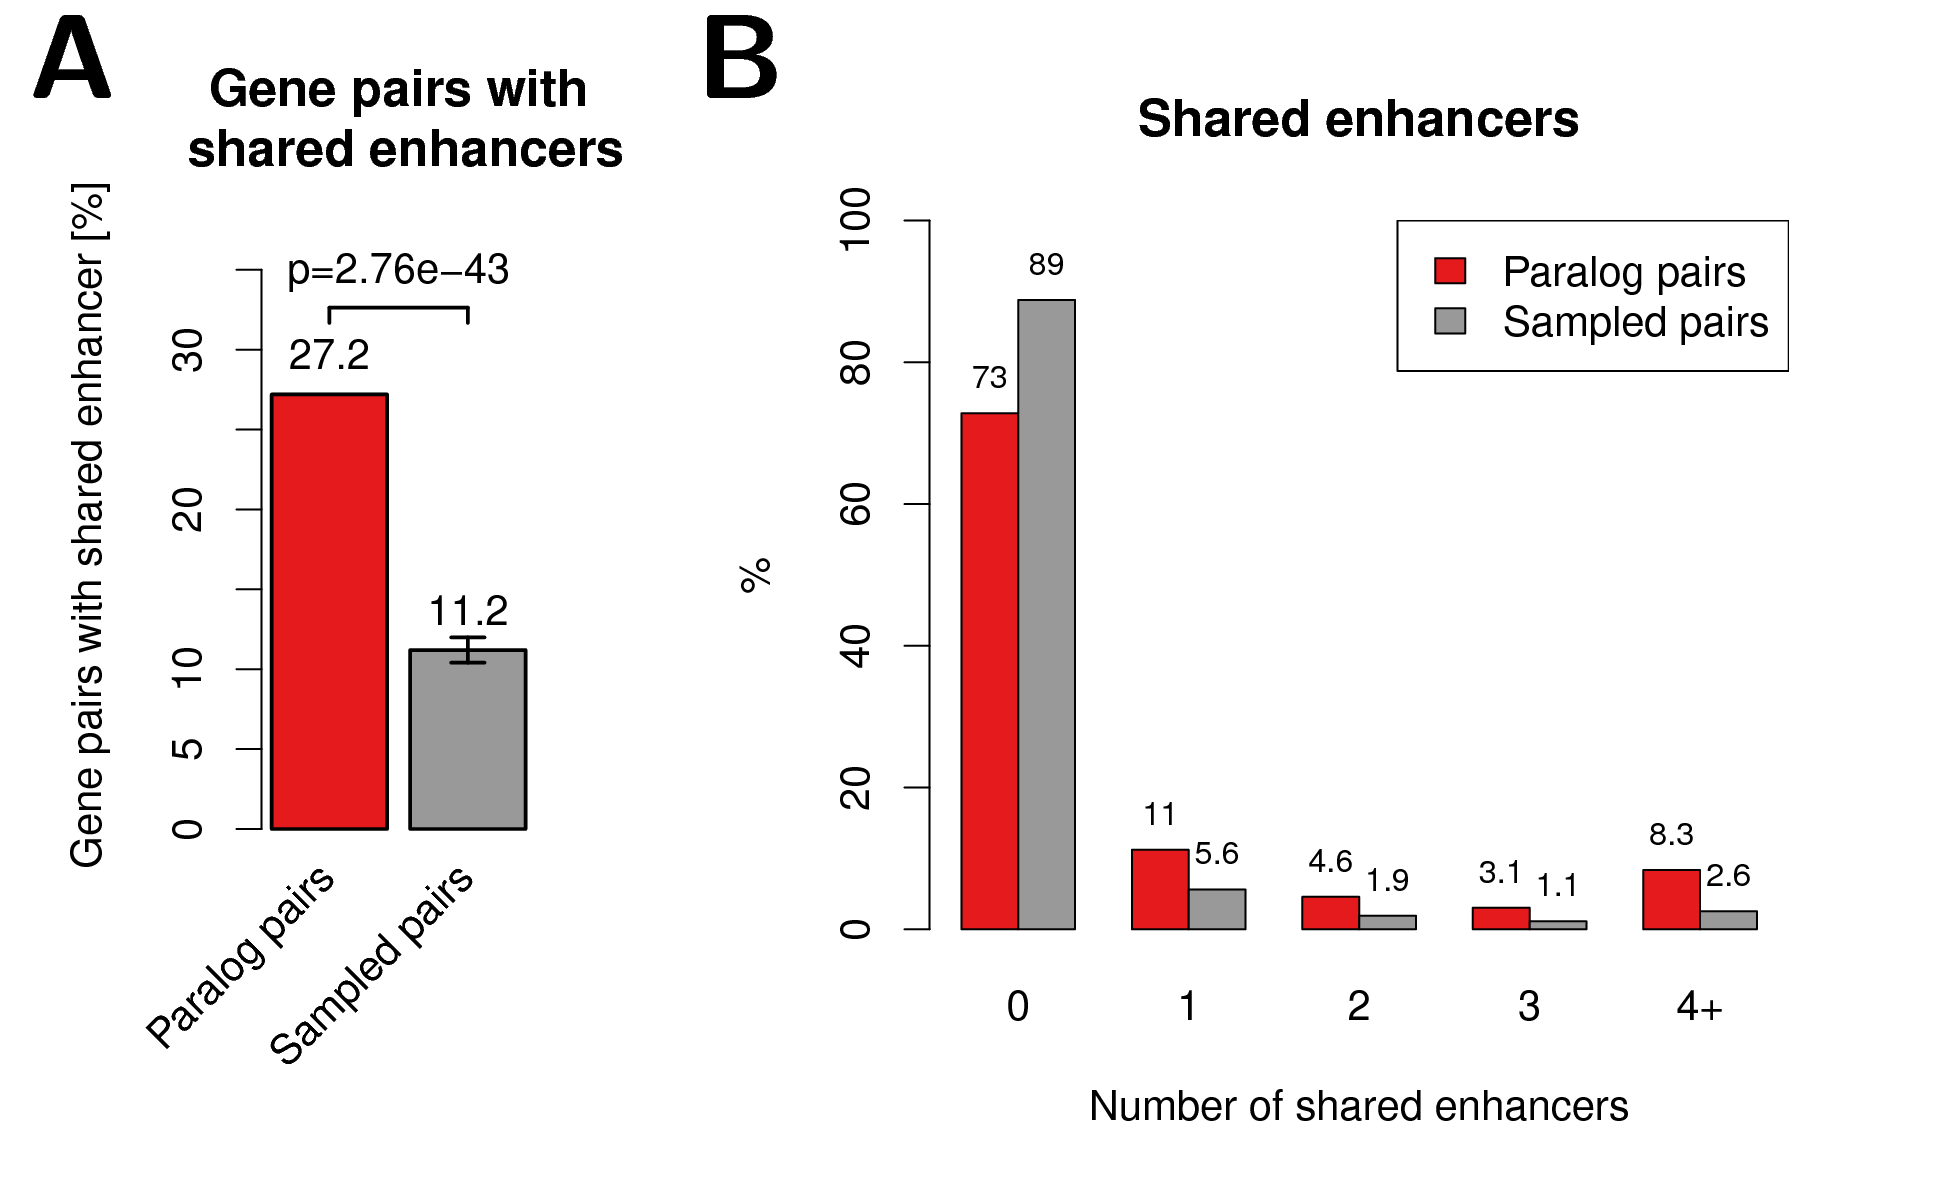
Figure 2.2: Shared enhancers among paralog gene pairs. (A) Percent of close paralog (red) and sampled control (grey) gene pairs with at least one shared enhancer. (B) Percent of gene pairs versus number of shared enhancers for paralog and sampled control gene pairs.
While \(27.2\)% of the paralog gene pairs have at least one enhancer in common, we observed this for only \(11.7\)% of the sampled gene pairs (\(p=4.2\times10^{-40}\), Fig. 2.2A). This could be replicated when comparing against sampled gene pairs where in addition to distance and number of enhancers linked to single genes, also the transcription sense and gene length were taken into account during sampling of control gene pairs (\(p=3.4\times10^{-41}\) and \(p=5\times10^{-30}\), respectively; Fig. A.7). Next, we compared the percent of gene pairs with shared enhancers as a function of the number of shared enhancers between paralogs and sampled gene pairs. We observed that paralog pairs are enriched for higher number of shared enhancers compared to the sampled gene pairs (Fig. 2.2B). Together, these results indicate that paralog genes are more often co-regulated by common enhancer elements than other genes.
2.3.4 Co-localization of paralogs in TADs
To facilitate their function in gene regulation, distal enhancer elements need to interact physically via chromatin looping with promoter elements at the TSS of their target genes. These looping interactions occur frequently within so called topological associating domains (TADs). These are regions of hundreds of kb that show high rates of self-interactions and few interactions across domain boundaries in genome-wide Hi-C experiments (Dixon et al. 2012; Rao et al. 2014). Genes within the same TAD are therefore likely to have common gene regulatory programs (Le Dily et al. 2014; Nora et al. 2012).
We used TADs from Hi-C experiments in eight different human cell-types (HeLa, HUVEC, K562, KBM7, NHEK, IMR90, GM12878, and hESC) from two recent studies (Dixon et al. 2012; Rao et al. 2014). Notably, the called TADs differ in size between the two publications due to different resolution of Hi-C experiments and different algorithms used to call them from Hi-C contact matrices (Fig. A.8). TADs from (Rao et al. 2014) have a median size of around 240 kb and are nested, so that several small domains can occur within one ore more larger domains. In contrast TADs from (Dixon et al. 2012) are of 1 Mb on average and are defined as non-overlapping genomic intervals.
We hypothesised that paralog gene pairs might be located more often in the same TAD than expected by chance. Indeed, we found that, depending on cell-type and study, between \(35\%\) and \(73\%\) of close paralog pairs are located in the same TAD (Fig. 2.3A). In seven out of nine data sets this difference was significant (\(p<0.05\)) with respect to the sampled control gene pairs with the same linear distance. We also calculated a set of \(n=2,624\) stable TADs that are found in more than 50% of cell types analysed in (Rao et al. 2014). Notably, we found for paralog pairs a \(1.25\) fold enrichment to be located in the same stable TADs compared to sampled gene pairs (\(p=0.00013\), stable_TADs in Fig. 2.3A).
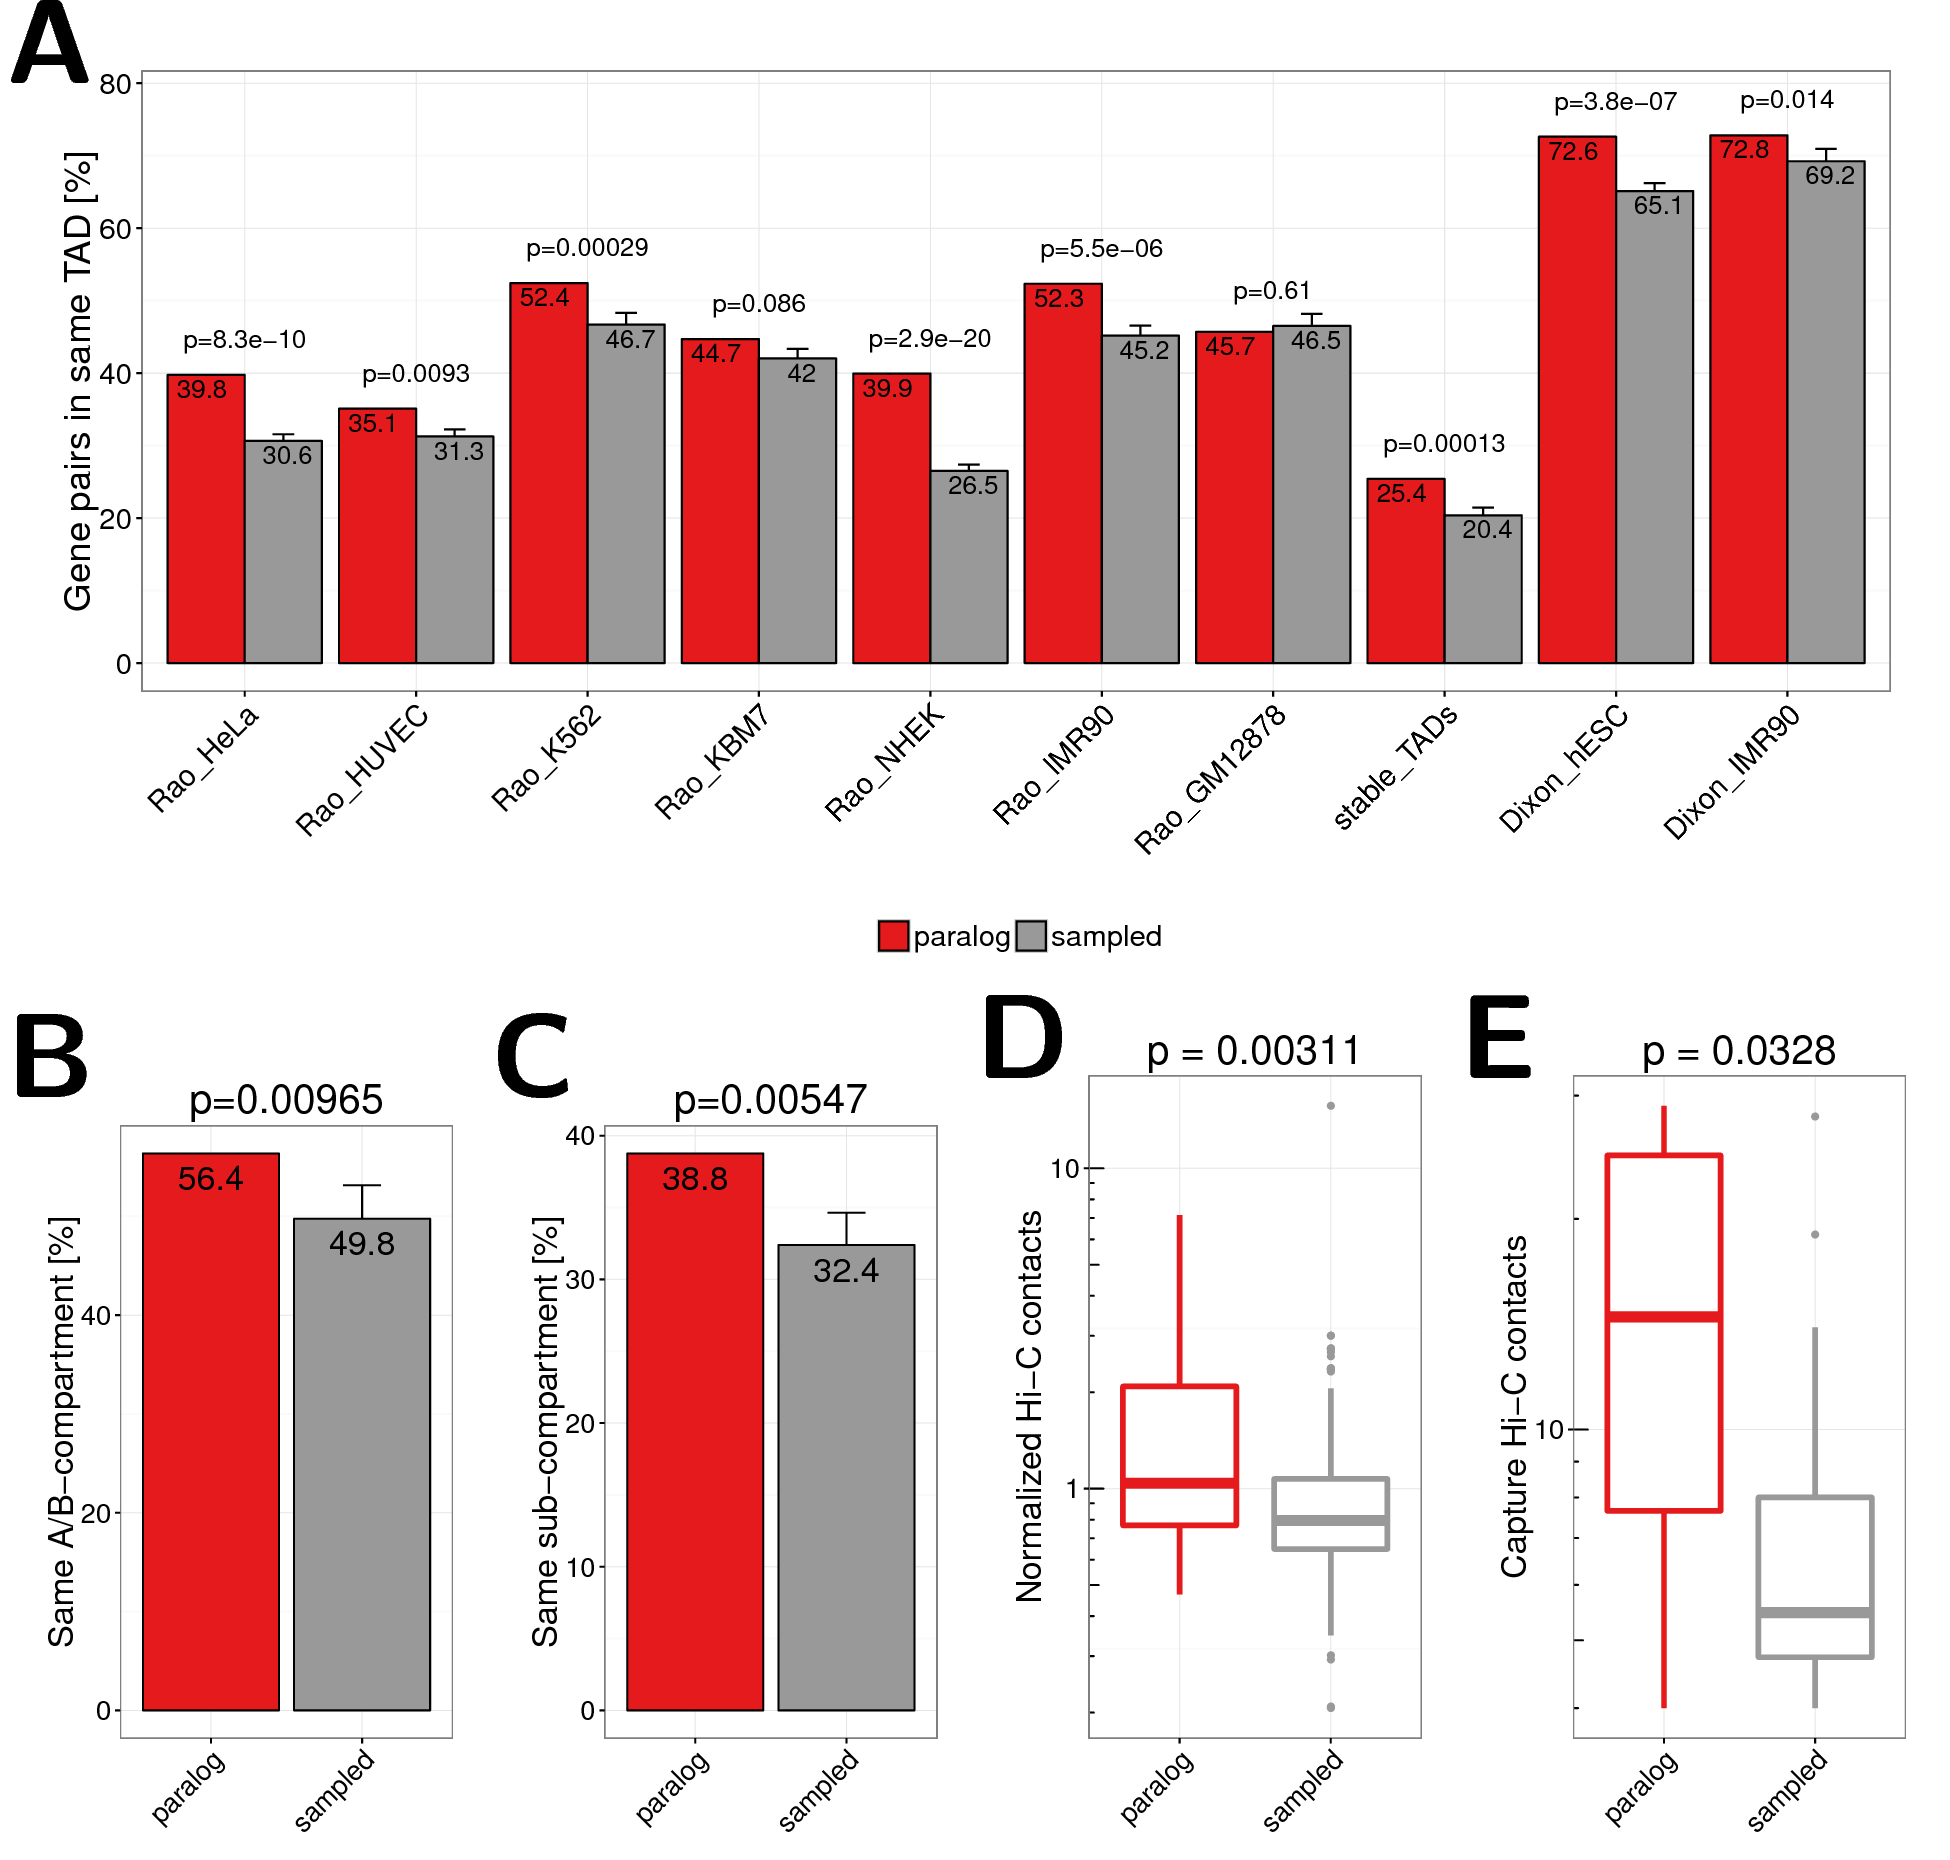
Figure 2.3: (A) Co-localization of close paralog genes within the same TAD compared against sampled gene pairs for TAD data sets from different cell types and studies. The first seven bars show values for TADs called in HeLa, HUVEC, K562, KBM7, NHEK, IMR90, and GM12878 cells by (Rao et al. 2014). The eighth bar shows the value for stable TADs across cell types form this study (at least 90% reciprocal overlap in 50% of cells). The last two bars show data for TADs called in hESC and IMR90 cells by (Dixon et al. 2012). Error bars indicate standard deviation in 10 times replicated sampling of gene pairs. P-values are computed using Fisher’s exact test. (B) Percent of gene pairs annotated to same A/B compartment according to Hi-C data in GM12878 cells from (Rao et al. 2014). Pairs located in the very same compartment interval were excluded. (C) Percent of gene pairs annotated to same sub compartment (A1, A2, B1, B2, B3, B4) according to (Rao et al. 2014). Pairs located in the same subcompartment interval were excluded. (D) Normalized Hi-C contact frequencies between TSSs of distal paralog gene pairs and sampled background gene pairs. (E) Promoter capture-C contact frequencies between distal paralog gene pairs and sampled background gene pairs.
Beside TADs, Hi-C interaction maps have revealed interaction patterns of two compartments (A and B) that alternate along chromosomes in intervals of several Mb. Thereby loci in A compartment preferentially associate with other loci in A and loci in B with others in B (Lieberman-Aiden et al. 2009; Rao et al. 2014; Dekker et al. 2013). We therefore asked whether pairs of paralogs from the same chromosome are preferentially located within the same compartment (both A or both B) whereby we excluded pairs that are in the same compartment interval. We found that \(56.4\%\) of paralogs on the same chromosome but not in the same compartment interval are in compartments of the same type. This was only observed for \(49.2\%\) of sampled pairs (\(p=0.0046\), Fig. 2.3B). Next we tested the same for recently distinguished sub-compartment types from high-resolution Hi-C interaction maps (Rao et al. 2014). Again, paralogs are enriched to be located within the same sub-compartment type (\(38.9\%\) vs. \(31.6\%\), \(p=0.0046\), Fig. 2.3C).
These results show that close paralogs are enriched to be located in the same regulatory unit of the genome as defined both by TADs and compartments.
2.3.5 Distal paralog pairs are enriched for long-range chromatin contacts
Since it was shown that actively transcribed genes are localized in the same active spatial compartments and tend to contact each other frequently in the nucleus (at their promoters (Cremer et al. 2015; Mifsud et al. 2015)) we hypothesised that this might be the case for distal paralogs on the same chromosome too. As spatial proximity can be approximated by Hi-C contact frequencies (Lieberman-Aiden et al. 2009) we compared the number of normalized Hi-C contacts between TSS of distal paralog genes (that have promoters separated by more than 1 Mb) to the sampled gene pairs with the same linear distances distribution. We used recently published in situ Hi-C data from IMR90 cells at 5kb bin-size resolution (Rao et al. 2014) and observed significantly more normalized chromatin interactions between paralog genes compared to sampled control gene pairs (\(p=0.0022\), Fig. 2.3D). We furthermore used an independent data set of high resolution promoter-promoter interactions measured by capture Hi-C (Mifsud et al. 2015). Again, we observed a strong enrichment of promoter-promoter interactions between distal paralogs compared to control genes pairs (\(p=0.027\), Fig. 2.3E). This shows that also distal paralogs are enriched for long-range interactions, indicating that they tend to be in closer spatial proximity than other genes.
2.3.6 Close paralogs have fewer contacts than expected
The observed enrichment of Hi-C contacts of paralogs is distance dependent. We observe for close paralogs fewer Hi-C contacts than for equally distant sampled gene pairs (Fig. 2.4A). To analyse this in more detail we focused on only those pairs on the same chromosome that have a TSS distance of at least 10kb but less than 1Mb. This is the distance range of most paralog pairs and allows to separate genes in Hi-C interaction maps and TADs (Fig. A.9A). Consequently, we observe paralogs more often in the same TAD in eight out of nine data sets for this distance range (Fig. A.9B). For these pairs we observe significant lower Hi-C contact frequencies if pairs are within the same IMR90 TAD (Rao et al. 2014) as compared to sampled genes (\(p=0.00094\)) but not if pairs are in different TADs (\(p=0.81\), Fig. 2.4B). We got comparable results when analysing the Capture Hi-C data the same way (Fig. A.9C). Next, we tested whether this can be explained by the nested sub-TAD structure of TADs called from high-resolution Hi-C in IMR90 (Rao et al. 2014). We divided pairs into four groups, namely, ’no TAD’, if both pairs are not in any TAD, ’different TAD’, if pairs do not have at least one TAD in common, ’different sub-TADs’, if they have at least one TAD in common but are in different sub-TADs, and ’same sub-TAD’, if they overlap exactly the same set of TADs. While we saw that paralogs are more often in the no TAD group (\(p=1.4\times10^{-20}\)), we found that they were highly depleted from the different TAD group (\(p=1.6\times10^{-40}\)) and highly enriched to be located within the same sub-TAD (\(p=4.2\times10^{-9}\), Fig. 2.4C). However, although not always significant, paralogs have fewer Hi-C contacts than sampled gene pairs in all of these groups (Fig. 2.4D). In addition, close paralogs within the same TAD share more enhancers than close paralogs not being in the same TAD (Fig. 2.4E). However, the positive correlation of gene expression over different tissues is not significantly higher for paralogs whether they are in the same TAD or not (Fig. A.10).
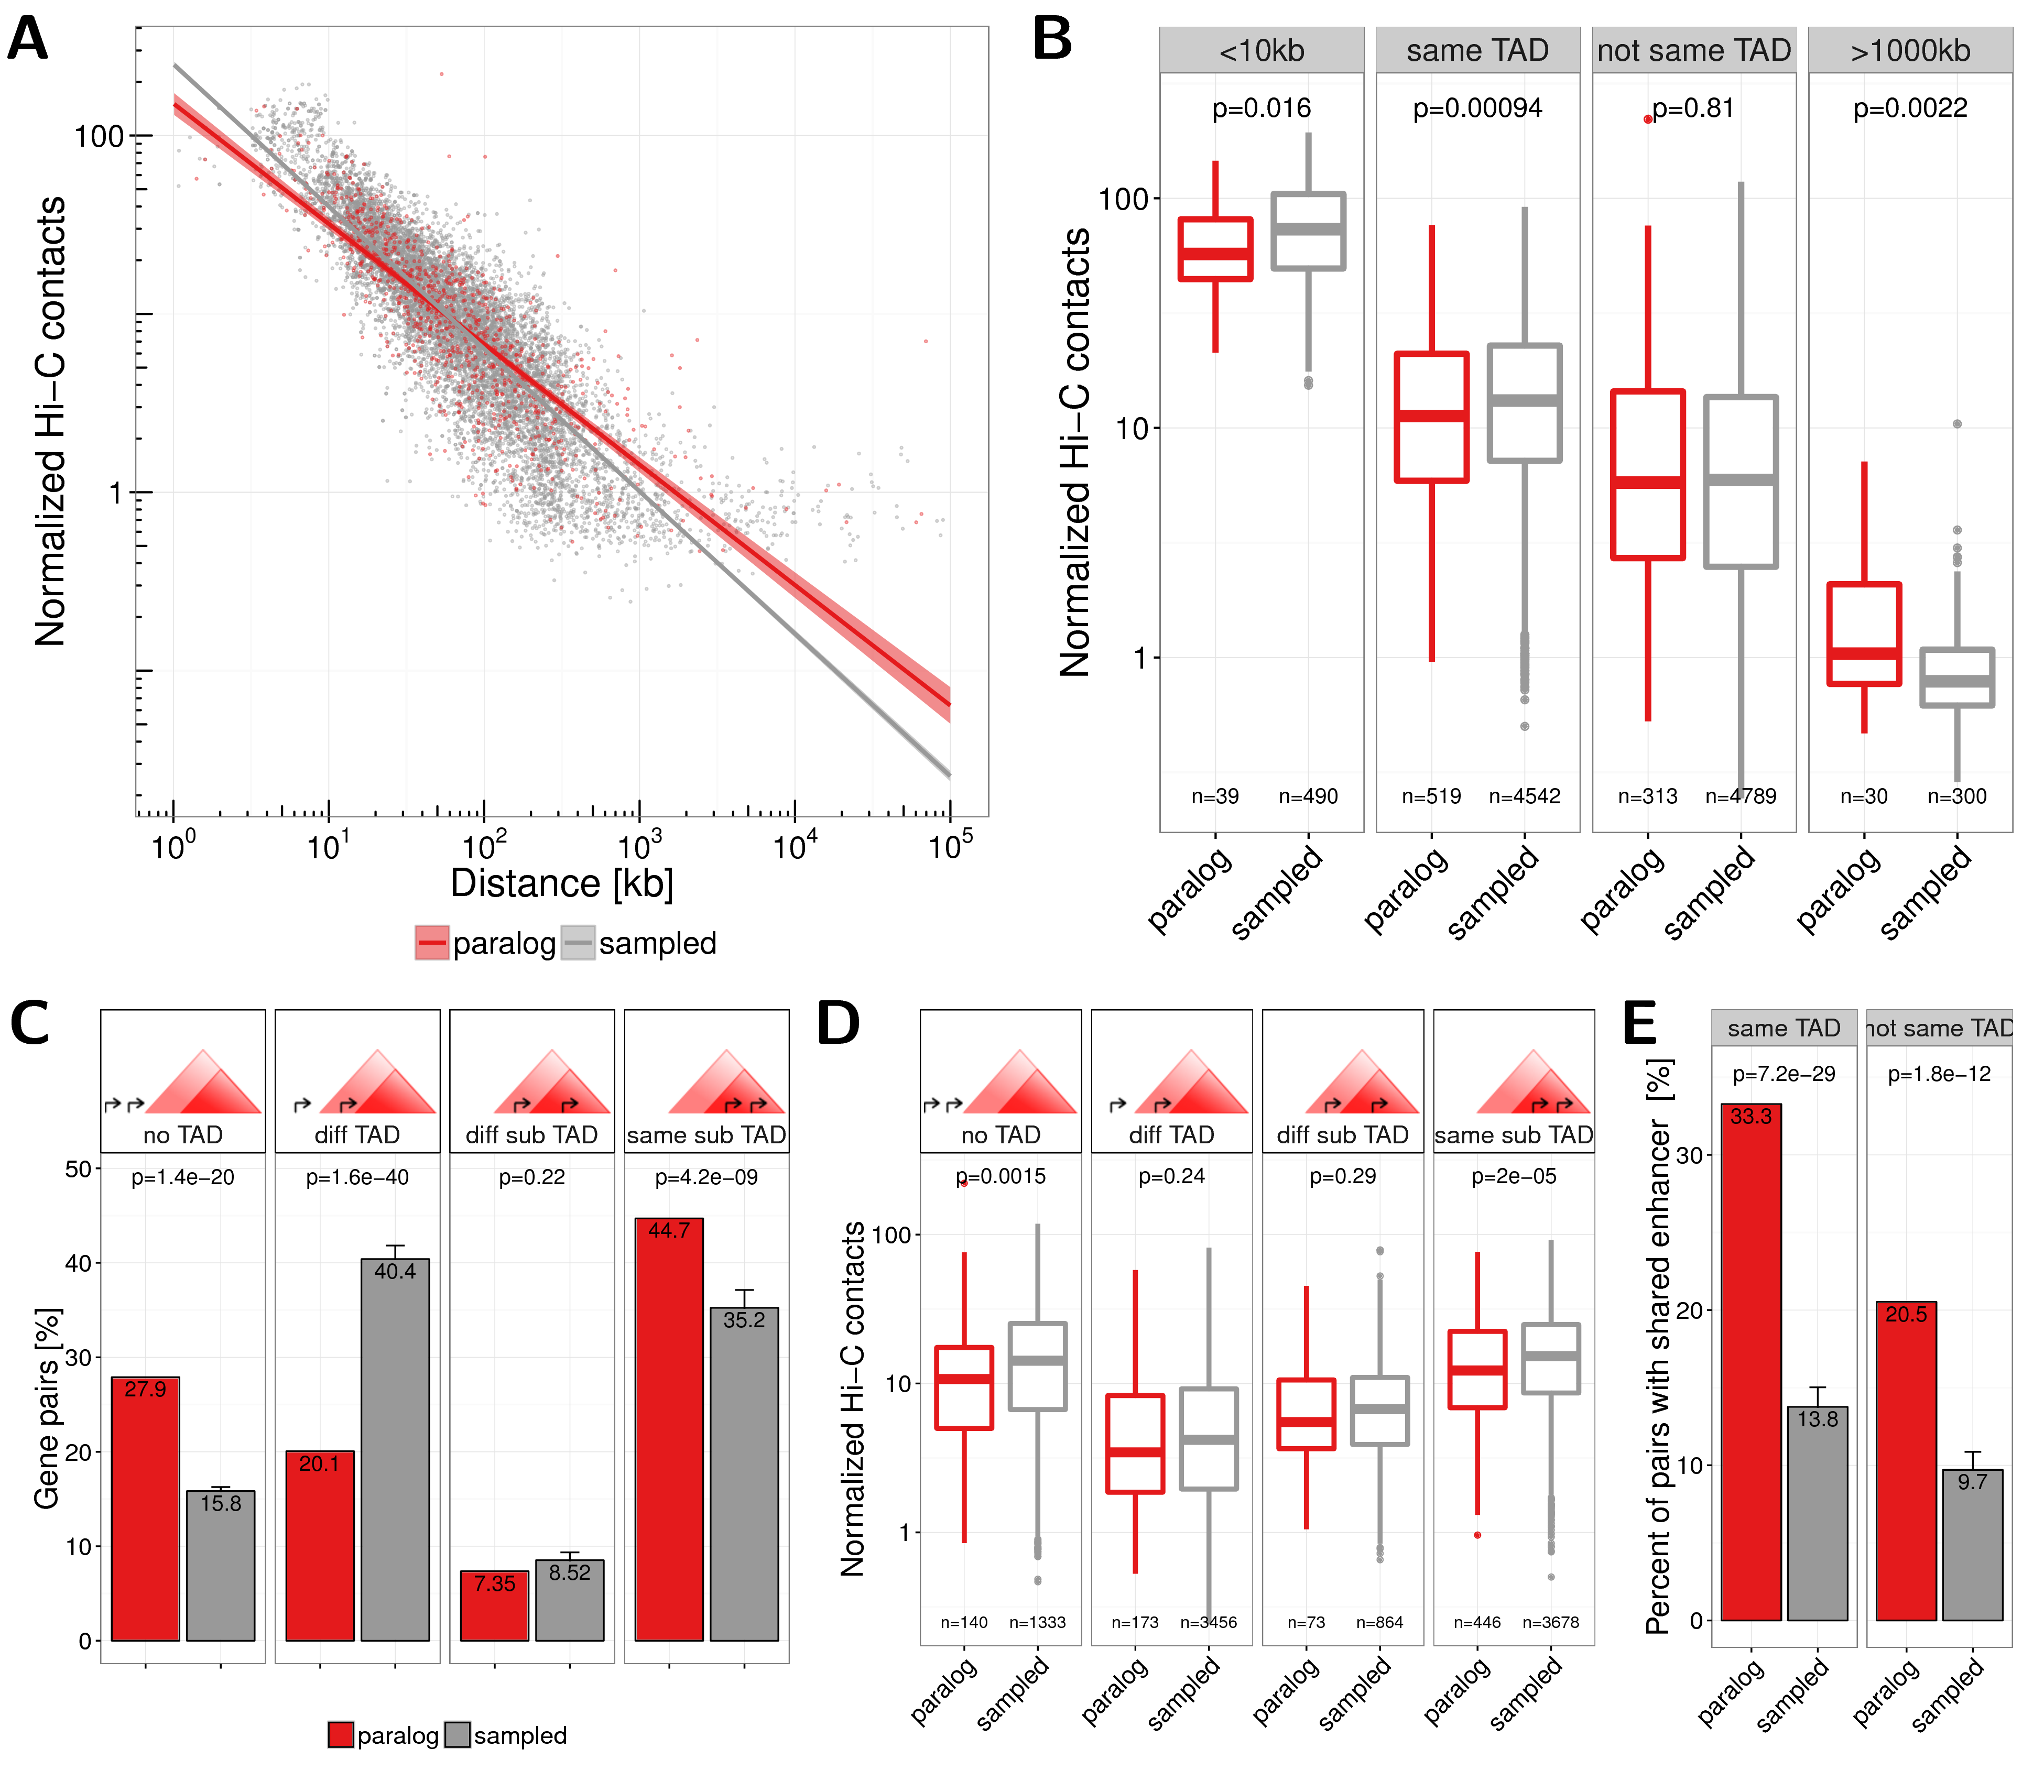
Figure 2.4: (A) Normalized Hi-C contacts by genomic distance between paralog (red) and sampled (grey) gene pairs. Lines show linear regression fit separately for paralogs (red) and sampled (grey) pairs with 95% confidence intervals in shaded areas. (B) Normalized Hi-C contacts between pairs of paralogs (red) and sampled gene pairs (grey) for the groups: $<$10kb genomic distance, located in the same TAD, not in the same TAD, and with genomic distance $>$1000kb. (C) Number of gene pairs located either in no TAD, in different TADs (or only one pair member in a TAD), both in a TAD but in different sub-TADs, or within the same sub-TAD, for paralogs (red) and sampled (grey) pairs. TADs from IMR90 cells from (Rao et al. 2014) were used, which nested in contrast to TAD calls from (Dixon et al. 2012). (D) Normalized Hi-C contacts between pairs of paralogs (red) and sampled gene pairs (grey) for the four groups of pairs in sub-TAD structures shown in (C). (E) Percent of gene pairs with at least one shared enhancer for paralog genes (red) and sampled control genes (grey) separated for pairs in the same IMR90 TAD (left) or not (right).
In summary, we observed that while close paralogs (situated at less than 1Mb) have more shared enhancers if they are in the same TAD than not, these within TAD paralog pairs have fewer contacts compared to other within TAD pairs of genes.
2.3.7 Paralogs in mouse and dog genome
Next, we asked whether the co-localization and co-regulation of paralogs is conserved in other species. For this, we conducted an analogous analysis with paralog gene pairs from mouse (M. musculus) and dog (C. familaris) genomes. Similar as for human data, we found that more than two third of the genes had at least one paralog copy (Fig. A.11A,D), paralog pairs clustered on the same chromosome (Fig. A.11B,E), and had close linear distances (Fig. A.11C,F).
We sampled control gene pairs with the same distance distribution as paralogs for both species separately (Fig. A.11C,F). We used TADs from recently published Hi-C data in liver cells of mouse and dog (Vietri Rudan et al. 2015), which have a size distribution comparable to TADs from human cells (Fig. A.8). We computed the fraction of paralog pairs that are located in the same TAD for both species. Consistent with the observation in human, we found that paralogs tend to colocalize more frequently within the same TAD in mouse (\(p=7.2 \times 10^{-22}\)) and dog (\(p=0.00064\)) than expected by chance (Fig. 2.5A). We also quantified directly the contact frequencies between promoters of distal paralogs on the same chromosome and found them significantly more frequently in contact than sampled gene pairs with the same genomic distance for paralogs in mouse (\(p=7\times 10^{-7}\)) and dog (\(p=0.008\)) (Fig. 2.5B). Together, these results indicate that enriched long-range interactions between paralogs are not human specific but rather a general evolutionary conserved feature of genome organization.
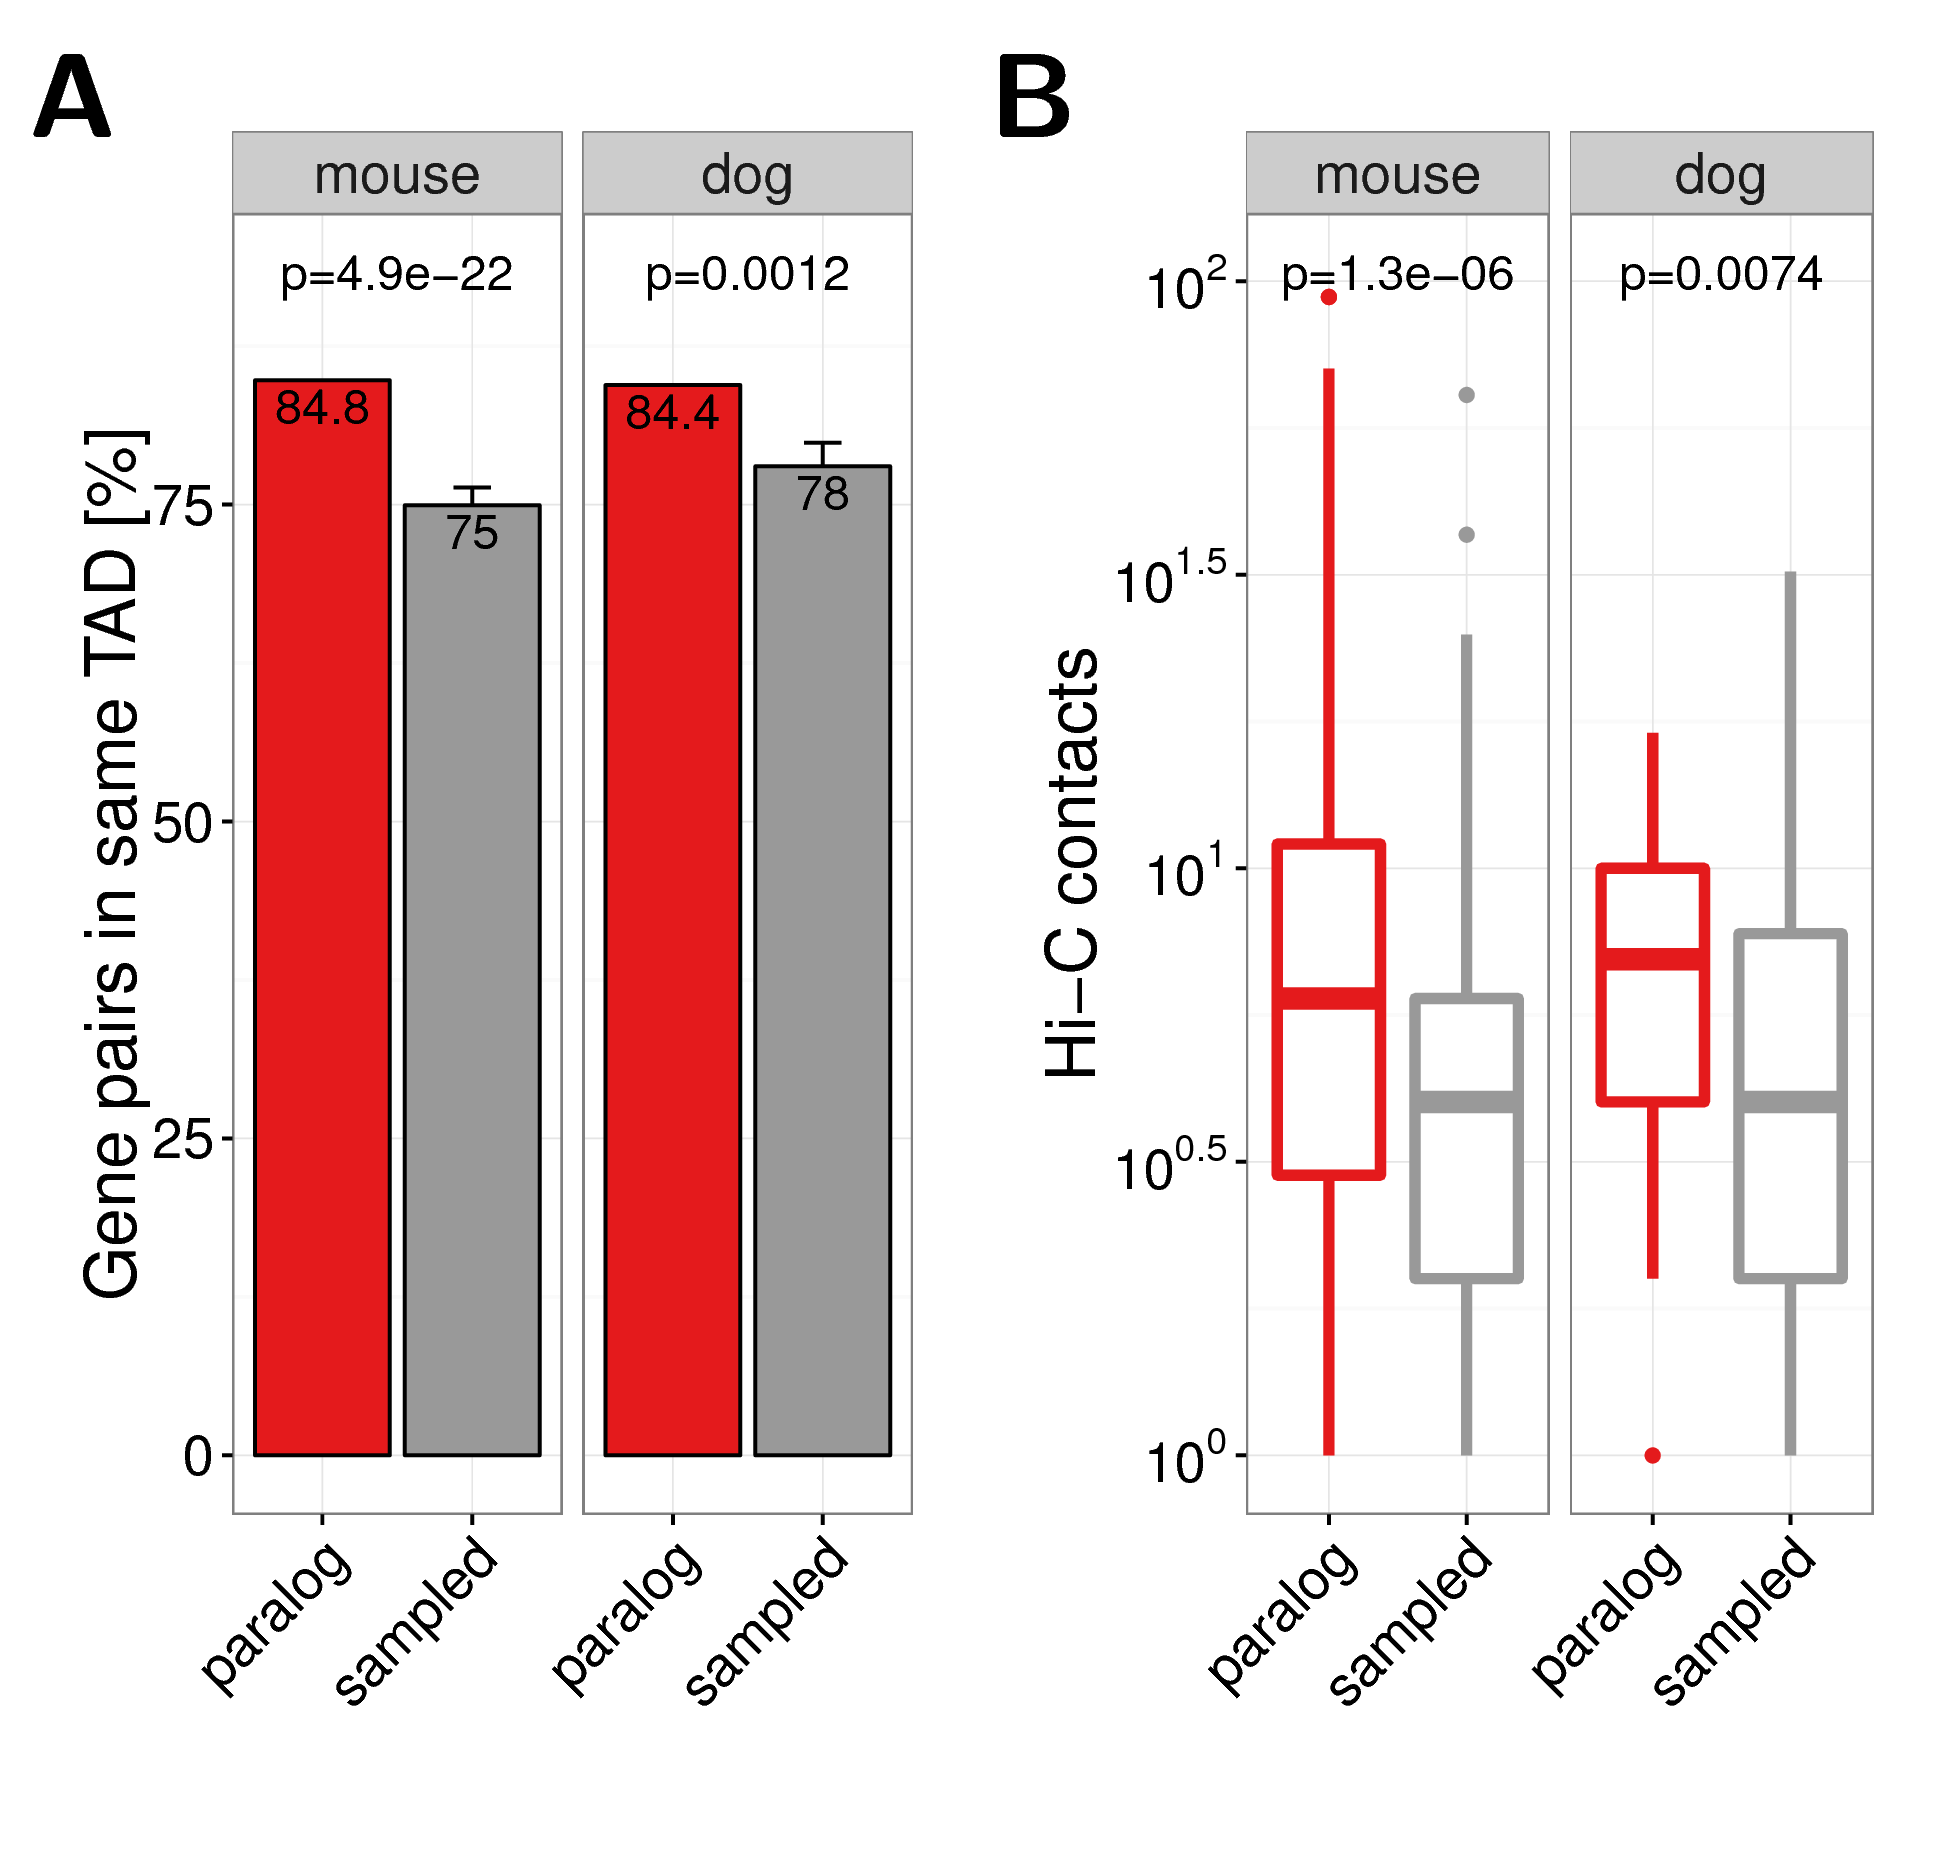
Figure 2.5: (A) Co-occurrence of close paralog genes with the same TAD in mouse (left panel) and dog (right panel). (B) Hi-C contacts between promoter of distal gene pairs in Hi-C experiments in liver cells from mouse (left panel) and dog (right panel). Hi-C data and TAD calls were taken from (Vietri Rudan et al. 2015).
2.3.8 Orthologs of human paralogs show conserved co-localization
Next, we wanted to test more directly whether the spatial co-localization of human paralogs is indeed conserved during evolution. In cases where the gene duplication event occurred before the separation of human and mouse (or human and dog) we can eventually assign each human gene of a pair of paralogs to one ortholog in mouse (or dog genomes) (Fig. A.12).
We could map \(37.1\%\) (\(n=579\)) and \(34.6\%\) (\(n=540\)) of the close human paralogs to one-to-one orthologs in mouse and dog, respectively (Fig. A.13A,D). We hypothesised that the two one-to-one orthologs of human paralog pairs would also be close in the mouse and dog genomes. Indeed, we found that the orthologs of human paralogs tend to cluster on the same chromosome (Fig. A.13B,E) and are biased for close linear distances (Fig. A.13C,F).
We further investigated how many one-to-one orthologs of the human paralog pairs were located in the same TAD in mouse and dog genomes. Although not significant, we found that mouse orthologs of close human paralogs share more often the same TAD in mouse than orthologs of sampled human gene pairs (\(80\%\) vs. \(76\%\), \(p=0.11\); Fig. 2.6A). Significant enrichment was observed with orthologs in the dog genome (\(85\%\) vs. \(77\%\), \(p=0.0016\); Fig. 2.6A).
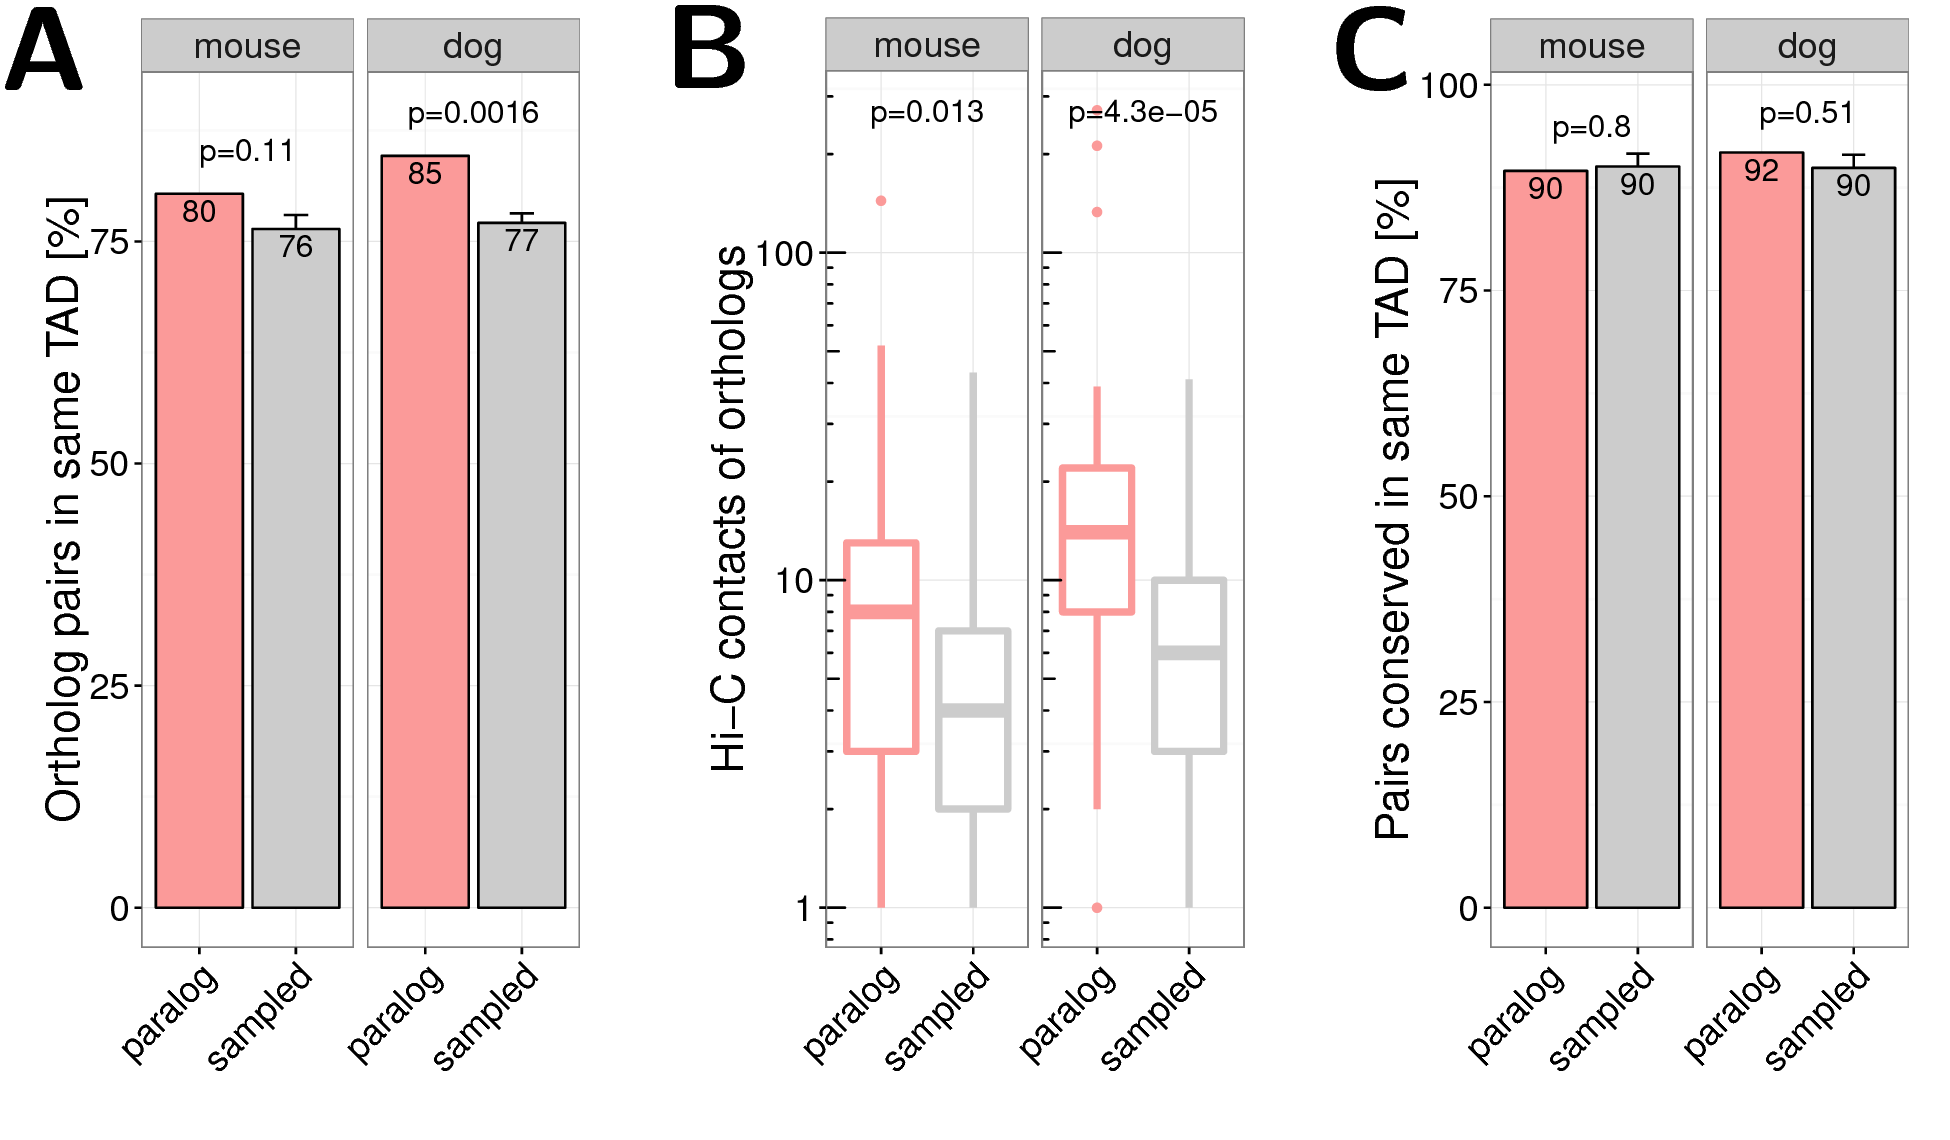
Figure 2.6: ** One-to-one orthologs of human paralog genes in mouse and dog genome.** (A) Percent of mouse (left) and dog (right) orthologs of human paralog pairs that are in the same TAD in the mouse and dog genome, respectively. (B) Normalized Hi-C contacts between promoters of one-to-one orthologs of human distal paralogs in the mouse (left) and dog (right) genome. (C) Percent of gene pairs with conserved co-localization. Orthologs in the same TAD in mouse (left) and dog (right) as percent of all orthologs of human paralog pairs that are in the same TAD in human. For human TADs from IMR90 cells from (Rao et al. 2014) were used.
For distal human paralogs we quantified the promoter contacts of their orthologs in mouse and dog and found enriched Hi-C contacts in mouse (\(p=0.011\)) and dog (\(p=2.4\times 10^{-5}\); Fig. 2.6B).
These results show that both the co-localization of paralogs in TADs and the contacts between distal paralogs are only weekly conserved at the evolutionary distances examined here. For example, we see that given a pair of human genes in the same TAD the likelihood of their orthologs being in the same TAD in mouse or dog is the same whether they are paralogs or not (Fig. 2.6C).
All together, our results support the notion that tandem duplications generate paralog gene pairs that are selected if they accommodate in TADs but following evolutionary events allow their reorganization outside TADs. While within oganisms distal paralog genes are coordinated, such coordination can be eventually erased by evolution.