5.2 Results
5.2.1 CTCF motif pairs as candidate chromatin loop anchors
In order to predict chromatin looping interactions from ChIP-seq data, we first analyzed which features at looping anchors correlate with interaction signals. As a starting point for all analyses we used 38,316 CTCF motif sites in the human genome as potential chromatin loop anchors. We built a dataset of all CTCF motif pairs located within a genomic distance of 1 Mb to each other. This resulted in 717,137 potential looping interactions; we expect that only a minority of these motif pairs will be in physical contact for a given cell type and condition. To label motif pairs as true loops, we used chromatin loops from published high-resolution in-situ Hi-C data and ChIA-PET data for CTCF and Pol2 in human GM12878 cells (Rao et al. 2014; Tang et al. 2015). If a motif pair was measured to interact in one of the data sets, we labeled it as true interaction. Overall 30,025 (4.19 %) of CTCF motif pairs were considered as true loops using these data sets.
5.2.2 Similarity of ChIP-seq signals at looping CTCF motifs
The ChIP-seq protocol involves a cross-linking step, in which formaldehyde treatment results in covalent bonds between DNA and proteins (Orlando et al. 1997). This allows the pull-down and detection of sites directly bound by the targeted protein. However, cross-linking occurs also between proteins, which results in detection of sites that are indirectly bound through protein-protein interactions or chromatin looping interactions (Hoffman et al. 2015; Starick et al. 2015).
We hypothesized that if a protein binds directly to a genomic region in chromatin contact with other genomic regions, DNA from both loci might be pulled out in the cross-linking and DNA-purification step of ChIP-seq protocols. As a result, we expect ChIP-seq signals (e.g. mapped reads) at both genomic regions: the directly bound one and the chromatin loop interaction partner locus (Fig. 5.1A).
To test this hypothesis, we used CTCF motif pairs as anchors and compared the ChIP-seq signal from one anchor to the (reversed) signal of the corresponding anchor. We found similar ChIP-seq coverage patterns around CTCF motifs more often when the two sites perform looping interactions than when they do not (Fig. 5.1B). To quantify the similarity of ChIP-seq coverage from any two CTCF sites, we correlated their ChIP-seq signals at +/- 500 bp around the CTCF motif (Fig. 5.1C) (see Methods for details). Measuring ChIP-seq profile similarity by correlation has the advantage that the correlation can be high even if the anchor that is not bound directly has a much lower ChIP-seq signal (which is often the case).
Next, we compared ChIP-seq similarity at looping and non-looping CTCF motif pairs for six selected TF ChIP-seq data sets (Fig. 5.1D). Compared to non-interacting CTCF sites the ChIP-seq correlation is significantly higher at looping interactions (Fig. 5.2A). However, the overall correlation as well as the difference between looping and non-looping CTCF sites varies between TF ChIP-seq datasets (Fig. 5.2A). As expected, we observed a large difference for the CTCF ChIP-seq dataset but, interestingly, also for other known architectural proteins, such as Rad21 and Znf143. Moreover, other TFs, such as STAT1 have significantly higher ChIP-seq signal similarity at CTCF motifs that interact via chromatin looping. Overall, this analysis shows that ChIP-seq signals are more similar at interacting CTCF sites, indicating that this similarity can be used to predict looping interactions.
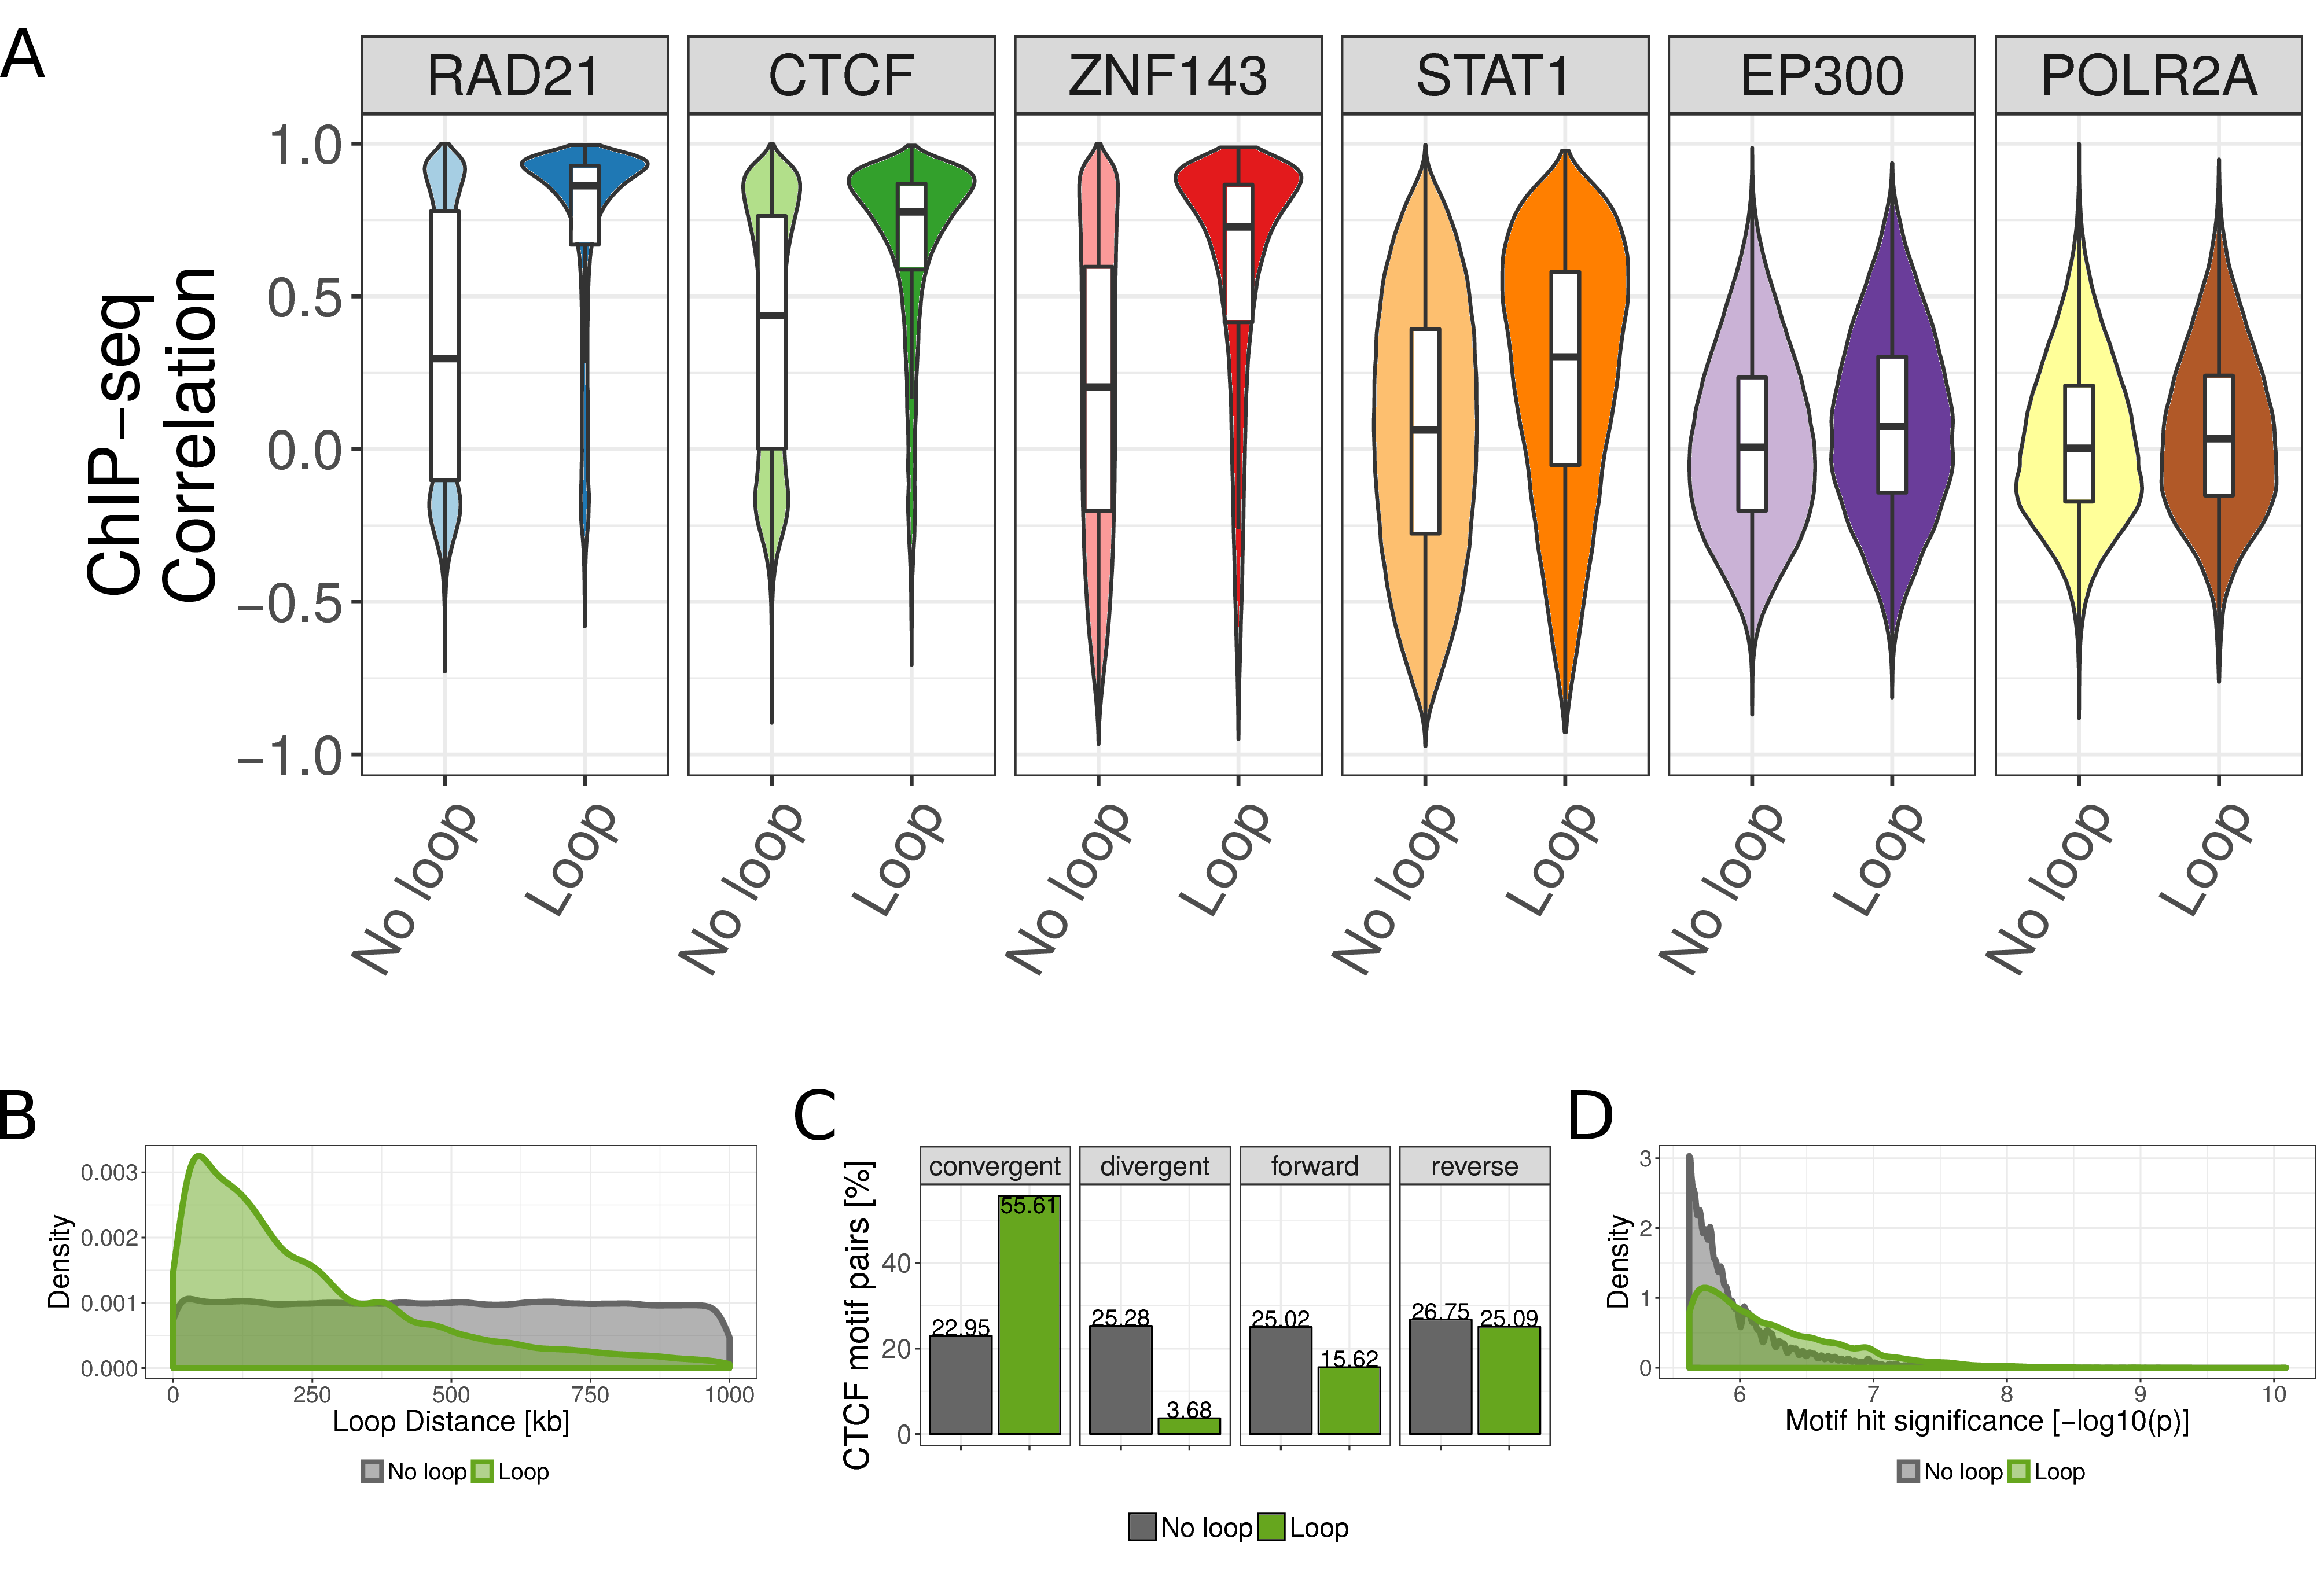
Figure 5.2: ChIP-seq similarity and genomic features of looping and non-looping CTCF motif pairs. (A) Boxplot of Pearson correlation coefficient of ChIP-seq signals between CTCF motif pairs for all CTCF motif pairs within 1 Mb genome-wide. The correlation is shown separately for non-looping and looping motif pairs (according to HI-C and ChIA-PET data in GM12878 cells), and for six selected ChIP-seq data sets in GM12878 cells. (B) Distance distribution between looping (green) and non-looping CTCF motif pairs. (C) Number of looping and non-looping CTCF motif pairs in convergent, divergent, both forward, or both reverse orientation. (D) Distribution of CTCF motif hit significance as \(-\log_{10}\) transformed p-value for looping and non-looping CTCF motif pairs. For each motif pair only the less significant motif is considered.
5.2.3 Genomic sequence features of CTCF motif pairs are associated with looping
The frequency of two genomic regions to physically interact depends on their genomic distance (Lieberman-Aiden et al. 2009). Consequently, we observed that CTCF motif pairs are more often in contact when they are close to each other in the genomic sequence (Fig. 5.2B). Recent studies on 3D chromatin structure led to an increased understanding of the molecular mechanism of chromatin loop formation and suggested a functional role of CTCF proteins, which bind specific DNA sequences (Merkenschlager and Nora 2016). The canonical CTCF motif is non-palindromic and therefore occurs either in the positive or in the negative DNA strand. Importantly, it is known that CTCF motifs occur predominantly in convergent orientation to each other at chromatin loop anchors (Rao et al. 2014; Vietri Rudan et al. 2015). Experimental inversions of CTCF motifs lead to changes of the interactions and expression of the associated genes (Guo et al. 2015; Wit et al. 2015). Accordingly, we observed that 55.6% of the looping CTCF pairs have convergent orientation versus only 25.3% of the non-looping pairs (Fig. 5.2C). We also observed that the motif match strength, as measured by the significance of a motif location to match the canonical CTCF motif (Khan et al. 2018), is higher for motifs involved in looping interactions (Fig. 5.2D). Together, the linear genome encodes several features, such as motif strength, orientation, and distance, that correlate with chromatin looping and can be used to predict such interactions.
5.2.4 Chromatin loop prediction using 7C
To make use of both the condition specific ChIP-seq signals and the genomic features of CTCF motifs to predict chromatin loops, we trained a prediction model that takes only ChIP-seq data as input. To this end, we built a logistic regression model that takes into account only four features: the correlation coefficient between the ChIP-seq signals of the paired CTCF motifs (in a window of 1000 bp around the motif), the genomic distance between motifs, the orientation, and the (minimum) motif hit significance score (see Methods for details). For each ChIP-seq data set, we trained and evaluated a separate model. The method is implemented as the R package ‘sevenC’, which predicts chromatin loops using as only input a bigWig file from a ChIP-seq experiment.
5.2.5 Prediction performance evaluation
We used 10-fold cross-validation to assess the performance of the predictions on independent data that was not seen in the training phase. For each cutoff on the predicted interaction probability score, we computed the sensitivity, specificity, precision and recall to plot receiver operator characteristic (ROC) and precision recall curves (PRC). Since only 4.2% of CTCF pairs are measured to interact, we mainly used the area under the PRC (auPRC) to evaluate prediction performance since, compared to ROC, the PRC gives a more accurate classification performance in imbalanced datasets in which the number of negatives outweighs the number of positives significantly (Saito and Rehmsmeier 2015). Furthermore, we defined an optimal cutoff for the prediction probability p based on optimizing the f1-score. The six selected TF ChIP-seq data sets have optimal f1-scores at about p = 0.15 (Figure S1B). For binary prediction, we provide a default prediction score threshold as the average of thresholds with optimal f1-score for the 10 best performing TF ChIP-seq datasets.
5.2.6 Prediction performance of 7C with sequence features and single TF ChIP-seq data sets
First, we evaluated how the sequence-encoded features can predict chromatin interactions. For this, we built regression models that use only these features. Each of these features alone, CTCF motif hit significance, motif orientation or distance, were very poor predictors, and resulted in auROC between 0.67 and 0.74 (Fig. 5.3A) and auPRC scores between 0.08 and 0.09 (Fig. 5.3C). Using the three sequence features together improved prediction performance (auROC = 0.85, auPRC = 0.22).
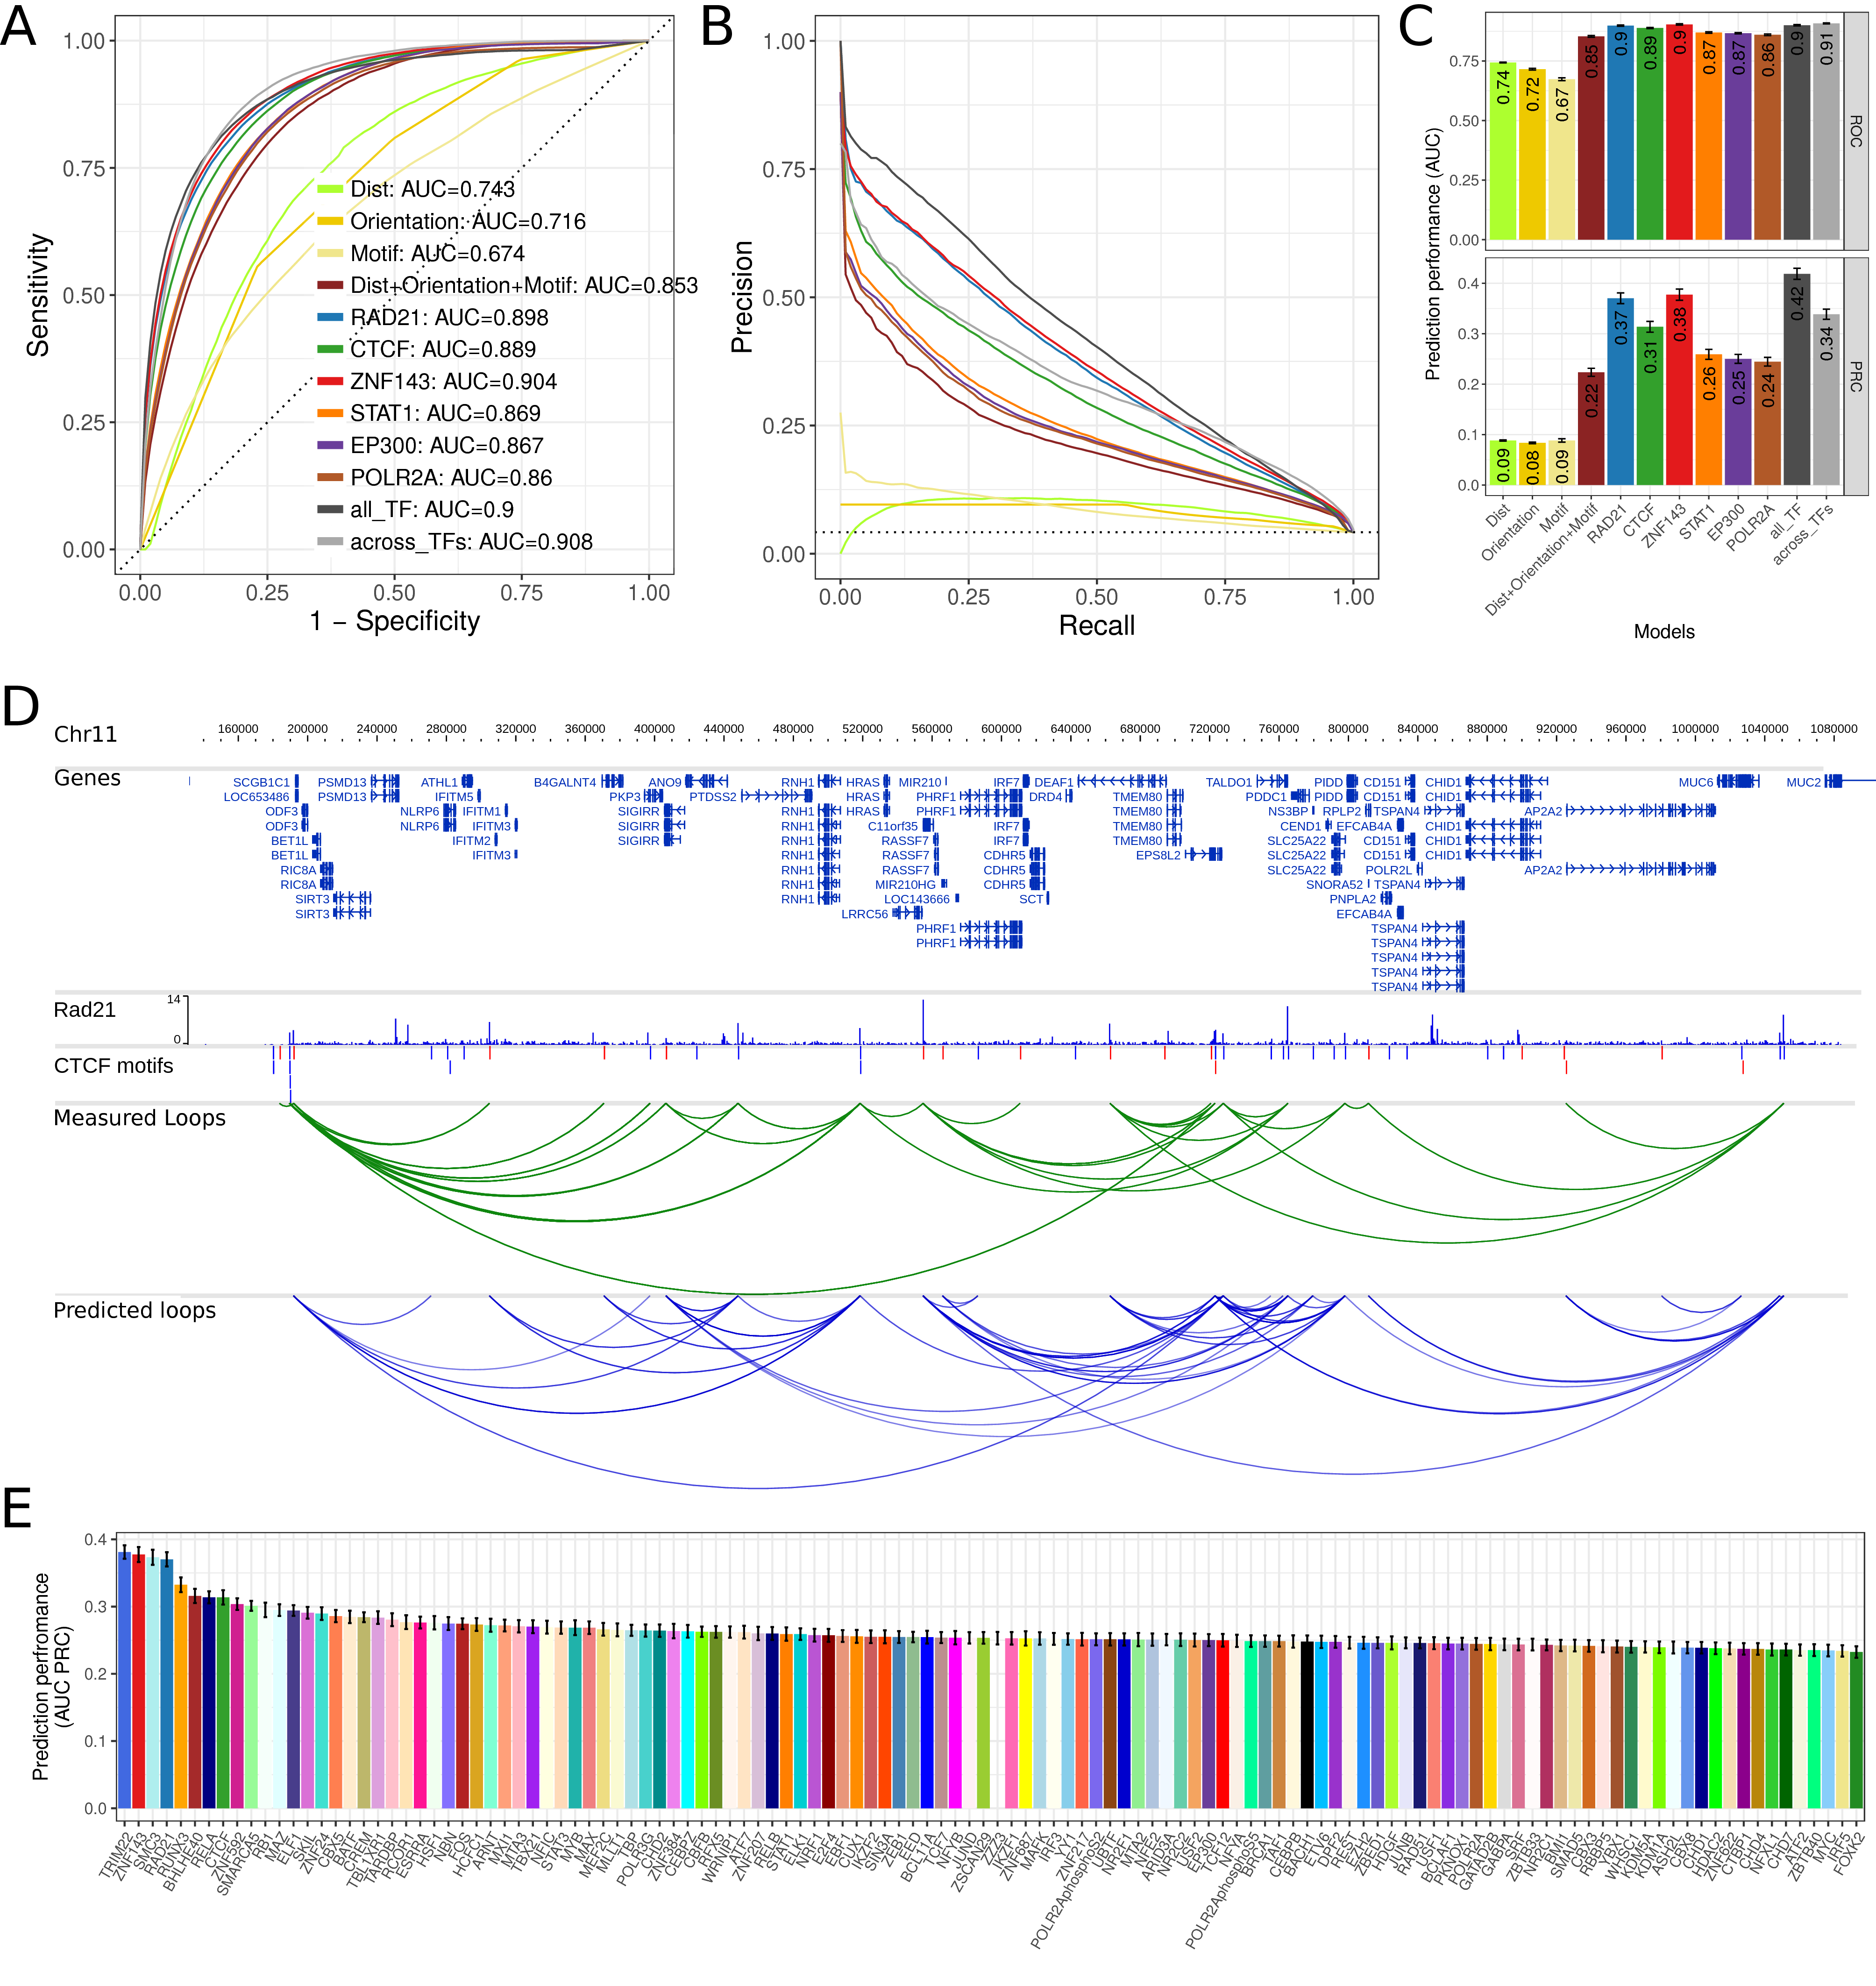
Figure 5.3: Prediction performance using cross-validation. (A) ROC plot for different models to predict chromatin looping interactions. The sensitivity (y-axis) is shown against the false discovery rate (1 – specificity, x-axis) for thresholds of the prediction score. Curves show averages of 10-fold cross-validation experiments. The models “Dist”, “Orientation”, and “Motif” contain only a single feature as indicated and all three genomic features are combined in the model “Dist+Orientation+Motif”. The models “RAD21”, CTCF”, “ZNF143”, “STAT1”, “EP300”, and “POLR2A”, contain the genomic features and the ChIP-seq correlation of the indicated factor. The model “all_TF” contains the genomic features and correlation of all indicated TFs. The model “across_TFs” contains the genomic features and a single correlation feature across the six ChIP-seq datasets as described in the main text. (B) PRC plot of precision against the recall for different prediction models. Color code as in (A). (C) Values of the area under the ROC (top) and PRC curves (bottom) as prediction performance. Error bars indicate standard deviation in 10-fold cross-validation experiments. (D) Example region on chromosome 11 in the genome browser showing: human genes, RAD21 ChIP-seq data in GM12878, CTCF motifs, CTCF motif pairs with that interact according to Hi-C or ChIA-PET data (green arcs) and predicted chromatin loops from RAD21 ChIPseq data using 7C (blue arcs). (E) Prediction performance of 7C as auPRC values for models with 124 TF ChIP-seq data sets from ENCODE. Error bars as in (C).
Next, we tested the addition of ChIP-seq data as feature in the prediction model using ChIP-seq data for each of six different TFs. Three of them, CTCF, RAD21, and ZNF143, have known function in chromatin loop formation (Merkenschlager and Nora 2016; Ye et al. 2016; Bailey et al. 2015), while STAT1, P300, and POL2, are to our knowledge not directly involved in chromatin loop formation (Fig. 5.1D). Adding any of these TF ChIP-seq datasets to the model increased prediction performance. STAT1, EP300, and POL2 only moderately increased prediction performance with auROC values between 0.86 and 0.87 (Fig. 5.3A) and auPRC between 0.24 and 0.26 (Fig. 5.3B, C). However, ChIP-seq of the known architectural proteins CTCF, RAD21, and ZNF143 resulted in markedly increased prediction performance with auPRCs of 0.31, 0.37, and 0.38 for CTCF, RAD21, and ZNF143, respectively (Fig. 5.3B, C). For visual comparison, we show the actual looping interactions and 7C predictions on an example region at chromosome 11 (Fig. 5.3D).
Finally, we built a full model using the sequence based features and the ChIP-seq data of all six selected TFs. This only resulted in a slight increase of prediction performance to auPRC = 0.42 (Fig. 5.3B, C), indicating that a single ChIP-seq experiment might be sufficient for accurate prediction of chromatin loops.
We also tested if a single value of correlation of ChIP-seq signal at both loop anchors across the six different TFs is predictive. Indeed, we find high prediction performance of auPRC = 0.34 for this approach. However, this was lower than using the correlation from single TF ChIP-seq experiments for RAD21 or ZNF143 and has the disadvantage of relying on ChIP-seq data from multiple experiments.
Together, these results show that sequenced based features alone have only a limited loop prediction performance, but integrating them with a single ChIP-seq experiment, 7C can predict chromatin loops with high accuracy.
5.2.7 Comparison of transcription factors by prediction performance
Our results can be used to better understand the molecular mechanisms of chromatin loop formation. We hypothesize that TFs whose ChIP-seq provides high prediction performance are likely to be functionally involved in chromatin looping. These TFs would be therefore interesting targets for further investigation of their potential function in chromatin looping.
To investigate this for as many TFs as possible, we used all available 124 TF ChIP-seq datasets from ENCODE for the human cell line GM12878 and compared transcription factors by their prediction performance. Notably, nearly all TF ChIP-seq data sets could increase the prediction performance of sequence-based features alone (Fig. 5.3E). However, there was a large variance in performance between TFs and a subset of TFs with high predictive power could be identified. These include for example the known architectural proteins mentioned above, CTCF, cohesin (RAD21 and SMC3), and ZNF143, but also factors, such as TRIM22, RUNX3, BHLHE40, or RELA, which might be interesting candidate factors with functional roles in chromatin loop formation.
5.2.8 Prediction performance in other cell types and for different TFs
Next, we wanted to test if 7C is general enough to predict looping interactions in a cell type different to the one used to train it. To test this, we used the models presented above (trained with data from human GM12878 cells) to predict loops using as input ChIP-seq data from human HeLa cells. The prediction performance was assessed using as positives 12,480 loops (1.74 % of all motif pairs) identified in HeLa cells (Rao et al. 2014; Tang et al. 2015). While prediction performance in HeLa cells is slightly lower as compared to the cross-validation in GM12878 cells, we see overall very good prediction performance also in HeLa cells by ROC curves (auPRC up to 0.91, Fig. 5.4A) and PRC curves (auPRC up to 0.27, Fig. 5.4B,C).
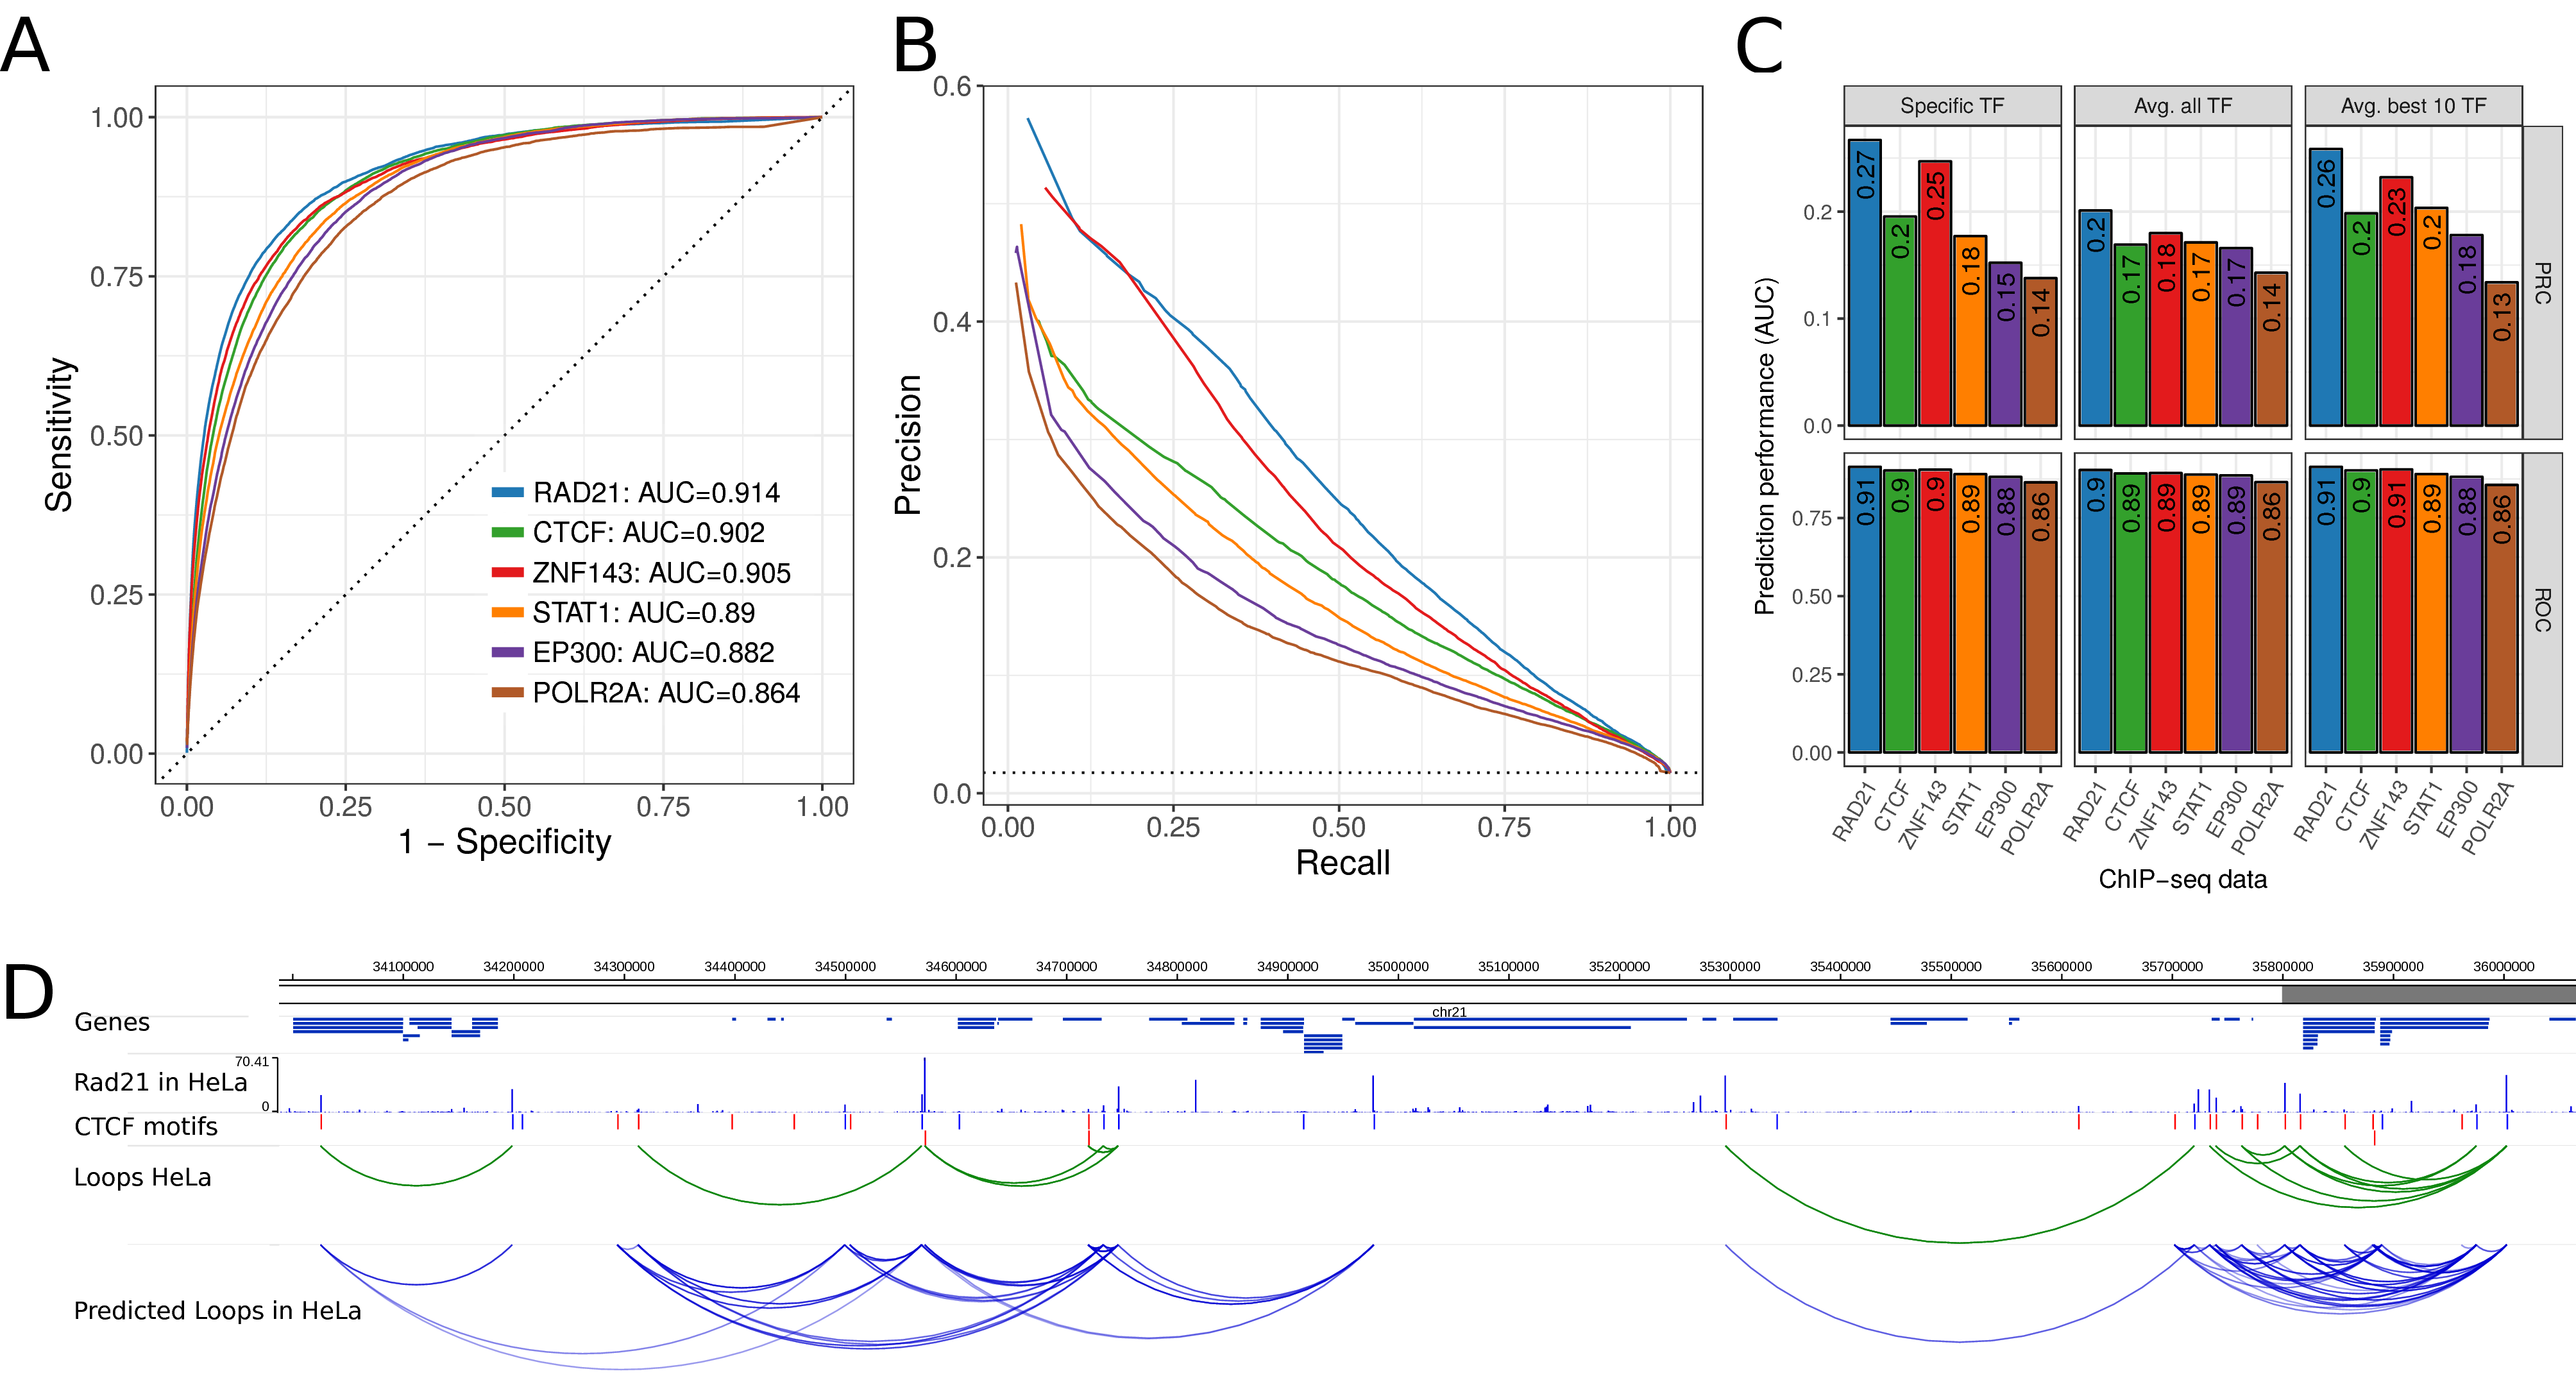
Figure 5.4: Prediction performance in HeLa cells using 7C trained in GM12878 cells. (A) ROC curve of prediction performance of six selected TF ChIP-seq data sets. The 7C model was trained using ChIP-seq and true loop data in human GM1287 but loops were predicted using ChIP-seq data of the same TFs in HeLa cells and true loop data in HeLa cells. (B) Precision-Recall curves for the same analysis as in (A). (C) Prediction performance as auPRC (top) and auROC (bottom) in HeLa for the six TF ChIP-seq data sets (x-axis) and 7C models trained for the specific TF (left), 7C with parameters averaged across all 124 TF models (center), and 7C with parameters as average of the 10 best performing TF ChIP-seq data sets (right). (D) Example region on human chromosome 21 with genes, RAD21 ChIP-seq data in HeLa, CTCF motifs, true loops in HeLa cells according to Hi-C and ChIA-PET (green arcs) and predicted chromatin loops from RAD21 ChIP-seq data in HeLa (blue arcs).
In this analysis, we compared the prediction performance of each specific TF model. However, in an application use case, one might not be able to train the model for a specific TF of interest and the model should predict loops for TFs that were not used in the training. Therefore, we built default 7C models by either averaging model parameters from all 124 TF models or by averaging across the model parameters of only the 10 best performing TFs.
While all three approaches result in good prediction performance for the six selected TFs (Fig. 5.4C), the model averaging parameters across all TFs performs poorer than the ones of only the best 10 models, which are actually nearly as good as the specific TF models. This is consistent with similar results from cross-validation analysis in GM12878 data (Fig. S1C). Furthermore, we visually inspected chromatin loop predictions from RAD21 ChIP-seq data in HeLa at an example loci on chromosome 21 (Fig. 5.4D). In summary, these results show that 7C can predict chromatin looping interactions in different cell types that were not used to train it. Similarly, the 7C default prediction model performs nearly as good as a TF specific model. This makes 7C applicable for ChIP-seq data from diverse TFs in many different cell types and conditions.
5.2.9 The high resolution of ChIP-nexus improves prediction performance
We wondered if the similarity of other genomics signals at loop anchors could potentially indicate looping interactions. Therefore, we used different genomic assays, such as DNase hypersensitivity (DNase-seq), ChIP-nexus and only ChIP-seq input material as input to our prediction methods (Fig. 5.5).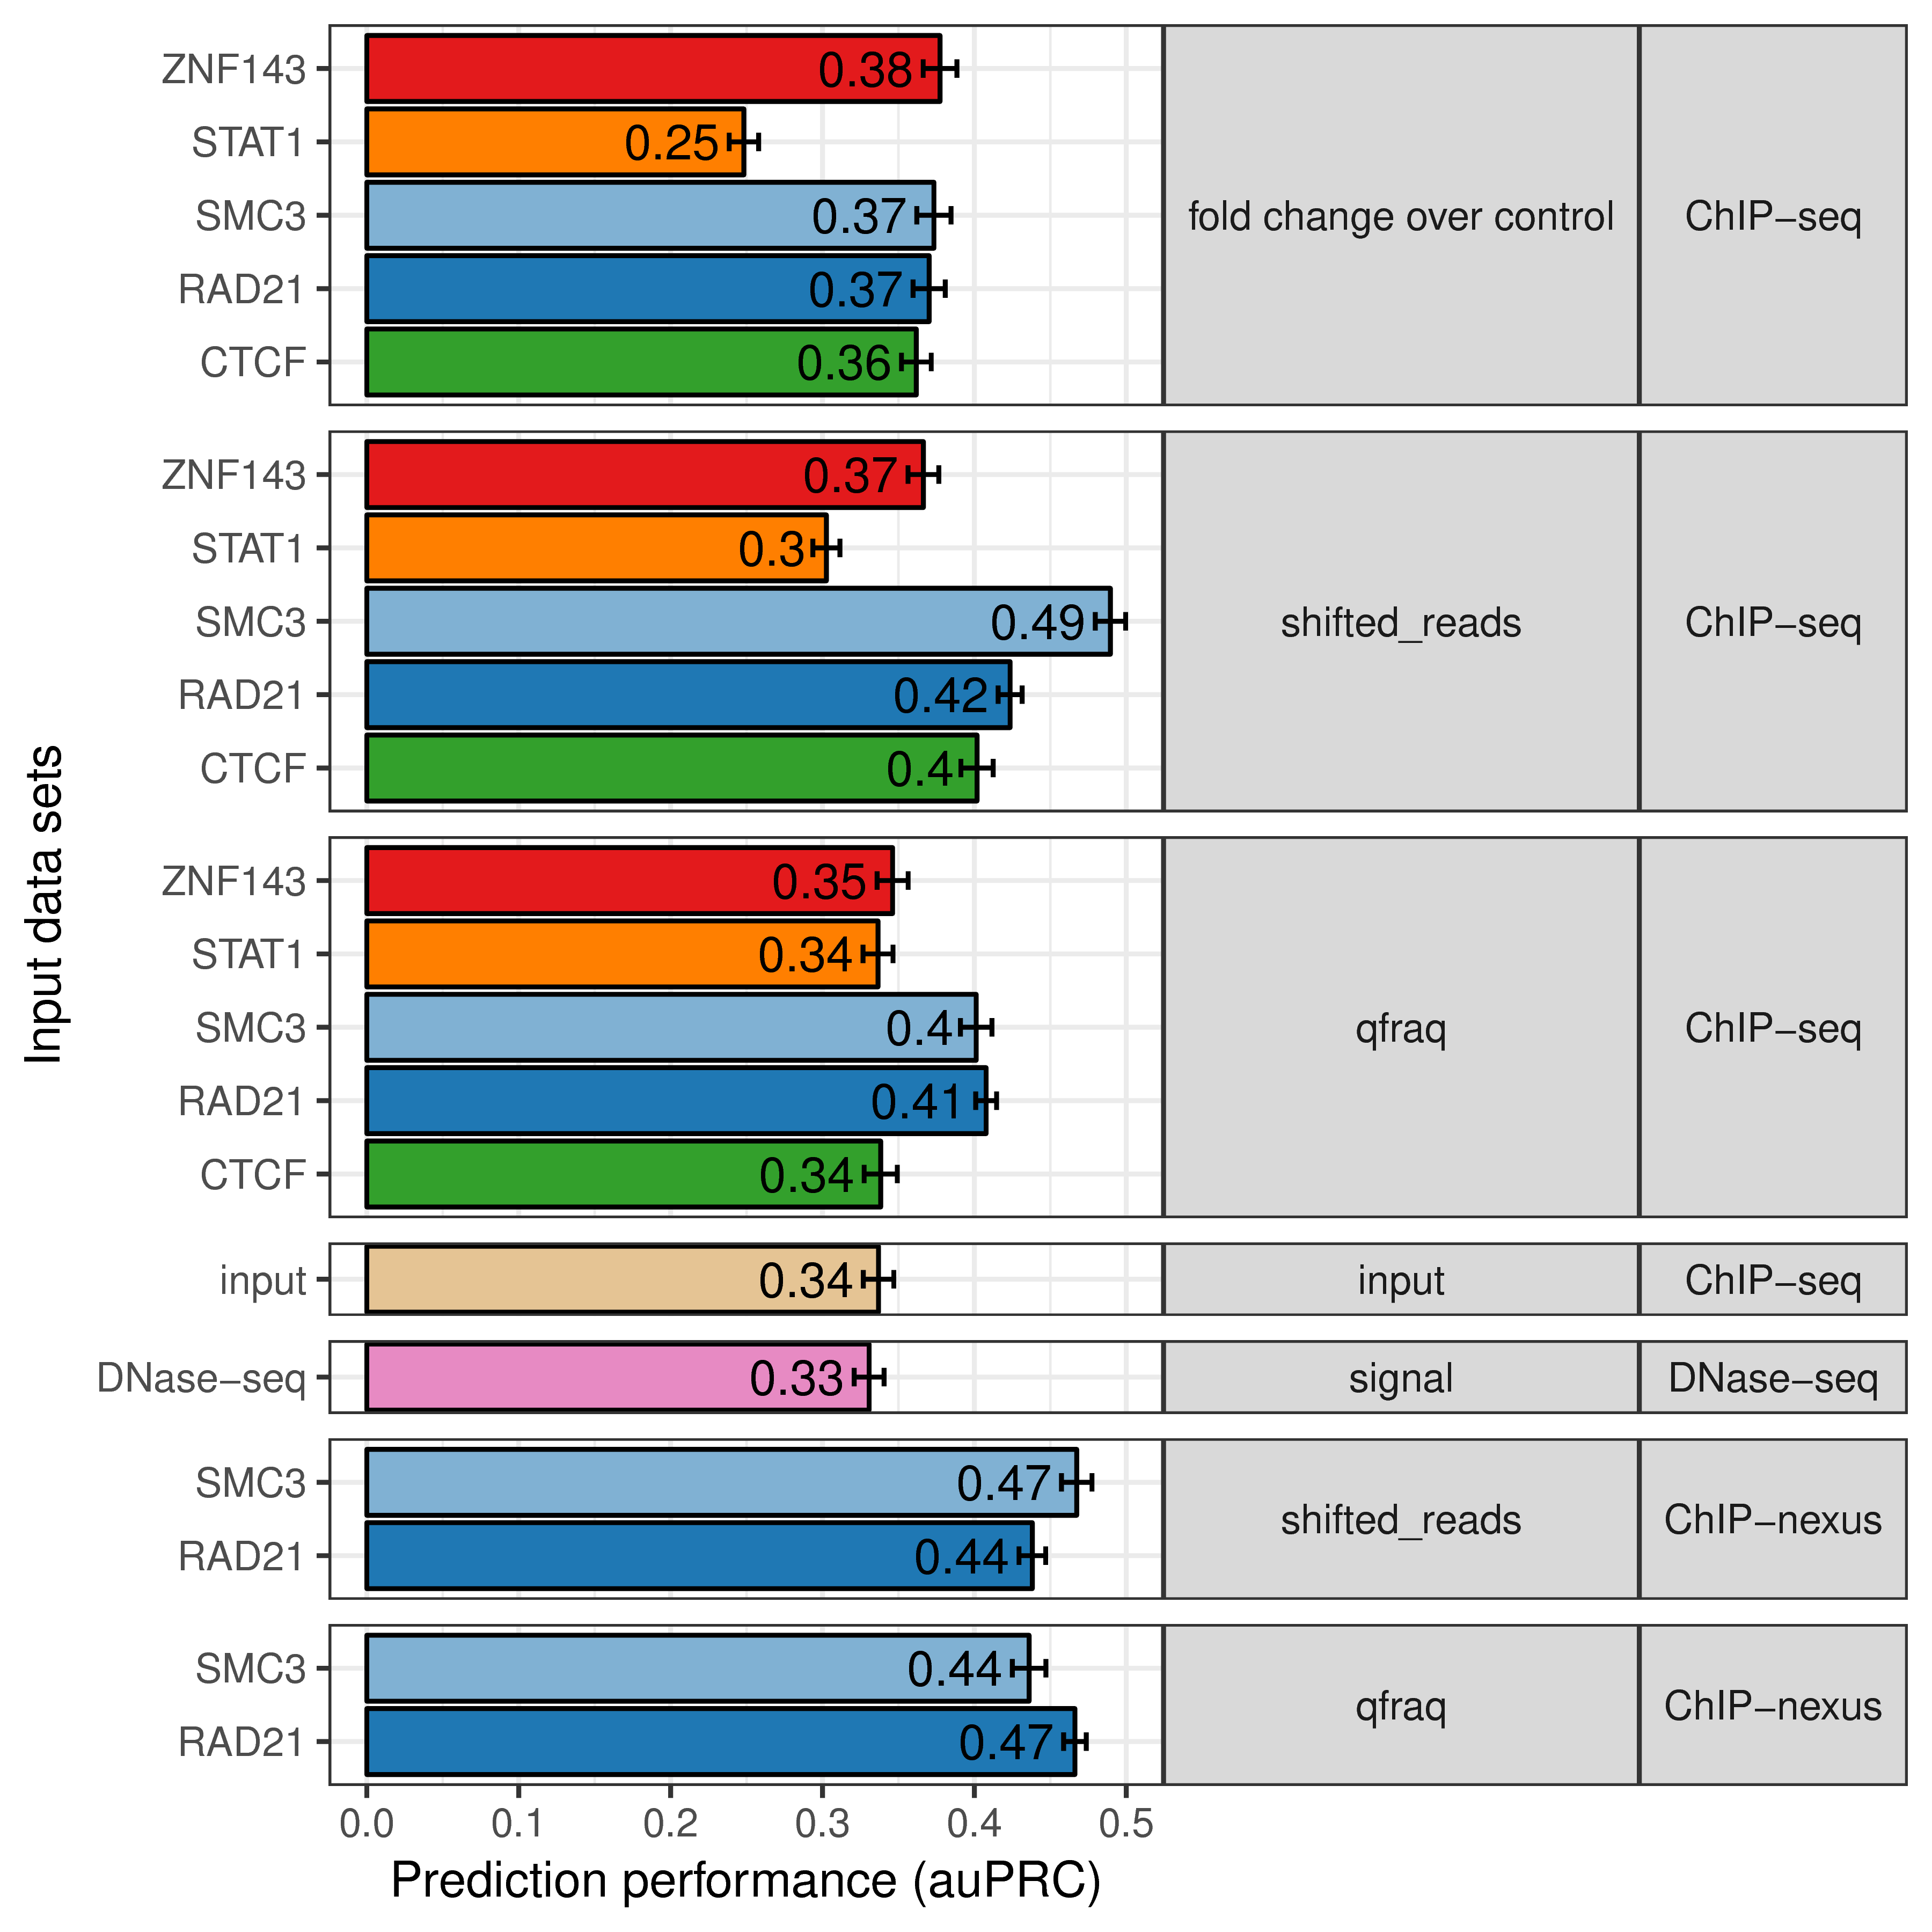
Figure 5.5: Higher resolution of ChIP-exo and ChIP-nexus improves prediction performance. Prediction performance as area under the precision recall curve (auPRC, x-axis) for 7C models with different input data sets to predict chromatin looping (y-axis). Input data sets are grouped by signal-type (middle panel) and assay-type (right panel) and colored according to the TF (if any) used in the experiment.
Furthermore, we compared different signal types of ChIP-seq. During computational processing of ChIP-seq raw data, reads are shifted in 5’ direction by the estimated average fragment size (Zhang et al. 2008; Hansen et al. 2015). The coverage of these shifted reads is then compared to coverage of input control experiment (fold change over control). Furthermore, a recent study quantified read pairs (qfrags) in a specific distance to each other as estimate for the actual fragment numbers detected by ChIP-seq (Hansen et al. 2015). For most of the TFs tested here, we observed that the ChIP-seq signal types ‘shifted reads’ and ‘qfrag’ have better loop prediction performance than the ‘fold change over control’ (Fig. 5.5). Interestingly, also the ChIP-seq input signal alone results in better prediction performance than sequence features alone, indicating that cross-linking efficiency and density of chromatin itself is specifically distributed at chromatin loop anchors (Fig. 5.5). Also, DNase-seq, which measures chromatin accessibility, predicts looping interactions with similar accuracy than ChIP-seq input control (Fig. 5.5). This is consistent with specific open-chromatin profiles at TF binding sites (Pique-Regi et al. 2011; Yardımcı et al. 2014).
However, using ChIP-nexus data for RAD21 and SMC3 (Tang et al. 2015), we could markedly improve chromatin loop predictions using 7C (Fig. 5.5). ChIP-nexus and ChIP-exo are variations of the ChIP-seq protocol, in which additionally, an exonuclease digestion step is applied to trim the DNA from the 5’ end until the actual bound protein (Rhee and Pugh 2011; He et al. 2015). These signals result in high-resolution binding footprints that can be used to identify different TF binding modes and cooperation with co-factors (Starick et al. 2015). Therefore, we conclude, that the high-resolution binding profiles from ChIP-nexus allow to compute a more predictive binding signal similarity at chromatin loop anchors.
In summary, the comparison of different genomic signal types shows that cross-linking effect and chromatin density at chromatin anchors are predictive signals for long-range chromatin interactions and higher resolution TF binding assays, such as ChIP-nexus, result in improved prediction performance.