• Thesis
  • Abstract
  • 1 Introduction
    • 1.1 Regulation of gene expression
    • 1.2 Distal regulation by enhancers
    • 1.3 Methods to probe the 3D chromatin architecture
      • 1.3.1 Microscopy-based techniques to visualize the genome in 3D
      • 1.3.2 Proximity-ligation based method to quantify chromatin interactions
    • 1.4 Hierarchy of chromatin 3D structure
      • 1.4.1 Chromosomal territories and inter-chromosomal contacts
      • 1.4.2 A/B compartments
      • 1.4.3 Topologically associating domains (TADs)
      • 1.4.4 Hierarchy of domain structures across genomic length scales
      • 1.4.5 Chromatin looping interactions
      • 1.4.6 TAD and loop formation by architectural proteins
    • 1.5 Dynamics of chromatin structure
      • 1.5.1 Dynamics across the cell cycle
      • 1.5.2 Dynamics across cell types and differntiation
    • 1.6 Evolution of chromatin organization
    • 1.7 Disruption of chromatin architecture in disease
    • 1.8 Aims of this thesis
    • 1.9 Structure of this thesis
  • 2 Paralog genes in the 3D genome architecture
    • Preamble
    • Abstract
    • 2.1 Introduction
    • 2.2 Materials and methods
      • 2.2.1 Selection of pairs of paralog genes
      • 2.2.2 Enhancers to gene association
      • 2.2.3 Topological associating domains
      • 2.2.4 Hi-C interaction maps
      • 2.2.5 Randomization
      • 2.2.6 Statistical tests
    • 2.3 Results
      • 2.3.1 Distribution of paralog genes in the human genome
      • 2.3.2 Co-expression of paralog gene pairs across tissues
      • 2.3.3 Paralog genes share enhancers
      • 2.3.4 Co-localization of paralogs in TADs
      • 2.3.5 Distal paralog pairs are enriched for long-range chromatin contacts
      • 2.3.6 Close paralogs have fewer contacts than expected
      • 2.3.7 Paralogs in mouse and dog genome
      • 2.3.8 Orthologs of human paralogs show conserved co-localization
    • 2.4 Discussions
    • 2.5 Conclusion
    • Acknowledgements
  • 3 Stability of TADs in evolution
    • Preamble
    • Abstract
    • 3.1 Introduction
    • 3.2 Results
      • 3.2.1 Identification of evolutionary rearrangement breakpoints from whole-genome alignments
      • 3.2.2 Rearrangement breakpoints are enriched at TAD boundaries
      • 3.2.3 Clusters of conserved non-coding elements are depleted for rearrangement breakpoints
      • 3.2.4 Rearranged TADs are associated with divergent gene expression between species
    • 3.3 Discussion
    • 3.4 Conclusion
    • 3.5 Methods
      • 3.5.1 Rearrangement breakpoints from whole-genome alignments
      • 3.5.2 Topologically associating domains and contact domains
      • 3.5.3 Breakpoint distributions at TADs
      • 3.5.4 Quantification of breakpoint enrichment
      • 3.5.5 Expression data for mouse and human orthologs
      • 3.5.6 Classification of TADs and genes according to rearrangements and GRBs
      • 3.5.7 Source code and implementation details
    • Declarations
      • Availability of data and material
      • Competing interests
      • Authors‘ contributions
      • Acknowledgments
  • 4 Position effects of rearrangements in disease genomes
    • Preamble
    • Abstract
    • 4.1 Introduction
    • 4.2 Materials and Methods
      • 4.2.1 Selection of subjects with apparently balanced chromosome abnormalities
      • 4.2.2 Clinical descriptions of DGAP cases
      • 4.2.3 Analysis of genes bordering the rearrangement breakpoints
      • 4.2.4 Assessment of disrupted functional elements and chromatin interactions bordering rearrangement breakpoints
      • 4.2.5 Ontological analysis of genes neighboring breakpoints
      • 4.2.6 Quantitative real-time PCR
      • 4.2.7 Assessment of DGAP breakpoints overlapping with non-coding structural variants in public databases
    • 4.3 Results
      • 4.3.1 Genomic characterization of non-coding breakpoints
      • 4.3.2 Identification of genes with potential position effects
      • 4.3.3 Identification of subjects with shared non-coding chromosome alterations and phenotypes
    • 4.4 Discussion
    • Declarations
      • Acknowledgements
      • Web Resources
  • 5 Prediction of chromatin looping interactions
    • Preamble
    • Abstract
    • 5.1 Introduction
    • 5.2 Results
      • 5.2.1 CTCF motif pairs as candidate chromatin loop anchors
      • 5.2.2 Similarity of ChIP-seq signals at looping CTCF motifs
      • 5.2.3 Genomic sequence features of CTCF motif pairs are associated with looping
      • 5.2.4 Chromatin loop prediction using 7C
      • 5.2.5 Prediction performance evaluation
      • 5.2.6 Prediction performance of 7C with sequence features and single TF ChIP-seq data sets
      • 5.2.7 Comparison of transcription factors by prediction performance
      • 5.2.8 Prediction performance in other cell types and for different TFs
      • 5.2.9 The high resolution of ChIP-nexus improves prediction performance
    • 5.3 Discussion
    • 5.4 Conclusion
    • 5.5 Methods
      • 5.5.1 CTCF motifs in the human genome
      • 5.5.2 Loop interaction data for training and validation
      • 5.5.3 ChIP-seq datasets in GM12878 cells
      • 5.5.4 ChIP-seq data types
      • 5.5.5 ChIP-nexus data processing for RAD21 and SCM3
      • 5.5.6 Similarity of ChIP-seq profiles as correlation of coverage around motifs
      • 5.5.7 Genomic sequence features of chromatin loops
      • 5.5.8 Chromatin Loop prediction model
      • 5.5.9 Training and validation of prediction model
      • 5.5.10 Analysis of prediction performance
      • 5.5.11 Implementation of 7C and compatibility to other tools
    • Declarations
      • Availability of data and material
      • Competing interests
      • Authors‘ contributions
      • Acknowledgments
  • 6 Discussion
    • 6.1 Co-regulation of functionally related genes in TADs
    • 6.2 Evolution by gene duplications and altered regulatory environments
    • 6.3 TADs are stable across large evolutionary time-scales
    • 6.4 Gene expression changes by altered TADs in disease
    • 6.5 Towards predicting regulatory pathomechanisms of structural variants
    • 6.6 Towards studying genome folding in specific conditions
      • 6.6.1 Interpretation of non-coding variants by interacting genes
      • 6.6.2 Cell type-specific regulatory interactions between enhancers and genes
      • 6.6.3 Variability of long-range interactions across individuals
      • 6.6.4 Genome folding in single cells
      • 6.6.5 Constantly improving targeted experimental methods.
    • 6.7 Molecular mechanisms driving genome folding
    • 6.8 Conclusions
  • References
  • Appendix
  • A Supporting Information: Co-regulation of paralog genes
  • B Supplementary Data: Stability of TADs in evolution
    • B.1 Supplementary Tables
    • B.2 Supplementary Figures
  • C Supplemental Data: Position effects of rearrangements in disease genomes
    • C.1 Supplemental Note
      • C.1.1 Case Reports
      • C.1.2 Nucleotide Level Nomenclature for DGAP karyotypes
    • C.2 Supplemental Figure
    • C.3 Supplemental Table Legends
  • D Supplemental Information: Prediction of chromatin looping interactions
    • D.1 Supplementary Tables
    • D.2 Supplementary Figures
  • E Contribution to individual publications
  • Zusammenfassung
  • Curriculum vitae
  • Acknowledgements
  • Build with bookdown

Genome folding in evolution and disease

6.1 Co-regulation of functionally related genes in TADs

The ability to measure gene expression genome-wide in many different tissues and conditions allowed the observation of clusters of co-expressed genes in higher eukaryotes (Boutanaev et al. 2002; Purmann et al. 2007). It was previously speculated that the structure of the chromatin and cis-acting units might be responsible for the observed co-expression (Sproul et al. 2005; Purmann et al. 2007). The ability to measure chromatin interactions leads to the discovery and characterization of TADs and enforces the question whether TADs insulate regulatory units in the genome to allow co-regulation of functionally similar genes.

To study the interplay between TADs, gene co-regulation, and evolution, we decided to focus on pairs of paralog genes. Paralogs arise from gene duplication events during evolution. Because of their homology and resulting sequence similarity, paralog genes often encode proteins with related functions. This makes them an exceptional model for functionally related and co-regulated genes. Indeed, in gene expression data from various sources across different cell types and tissues, paralogs have significantly increased expression correlation compared to other close genes (Chapter 2).

The main challenge in statistically analyzing paralog gene pairs was their bias for short genomic distances. Most duplications appear to be created by tandem duplications in direct orientation (Newman et al. 2015), which explains the clustering of paralogs in the genome and enrichment for being transcribed from the same DNA strand. These properties complicated our analysis by the need for an adequately sampled control set of gene pairs.

However, the development of careful sampling techniques results in control gene pairs that have similar properties regarding genomic distance, transcription strand, number of enhancers per gene, and the distance of enhancers to genes. These approaches allowed us to compare features of paralog gene pairs to random expectations in a statistically robust manner.

Our results show that paralogs are significantly enriched in TADs, frequently share the same regulatory enhancer and have increased Hi-C contacts, even when they are more than 1 Mb apart in the linear genome. These results show that evolutionary and functionally related genes tend to be co-regulated within TADs. Importantly, this highlights a functional organization of the three-dimensional genome, in which domain organization segregates distinct regulatory environments (Fig. 6.1).

Co-regulation by shared enhancers in TADs. (A) Example diagram showing the co-regulation of multiple genes by a single regulatory element within a TAD. (B) Diagram of the potential for TAD boundaries to serve an enhancer blocking role that restricts enhancers to target genes within the same TAD. Figure adapted from (Dixon et al. 2016).

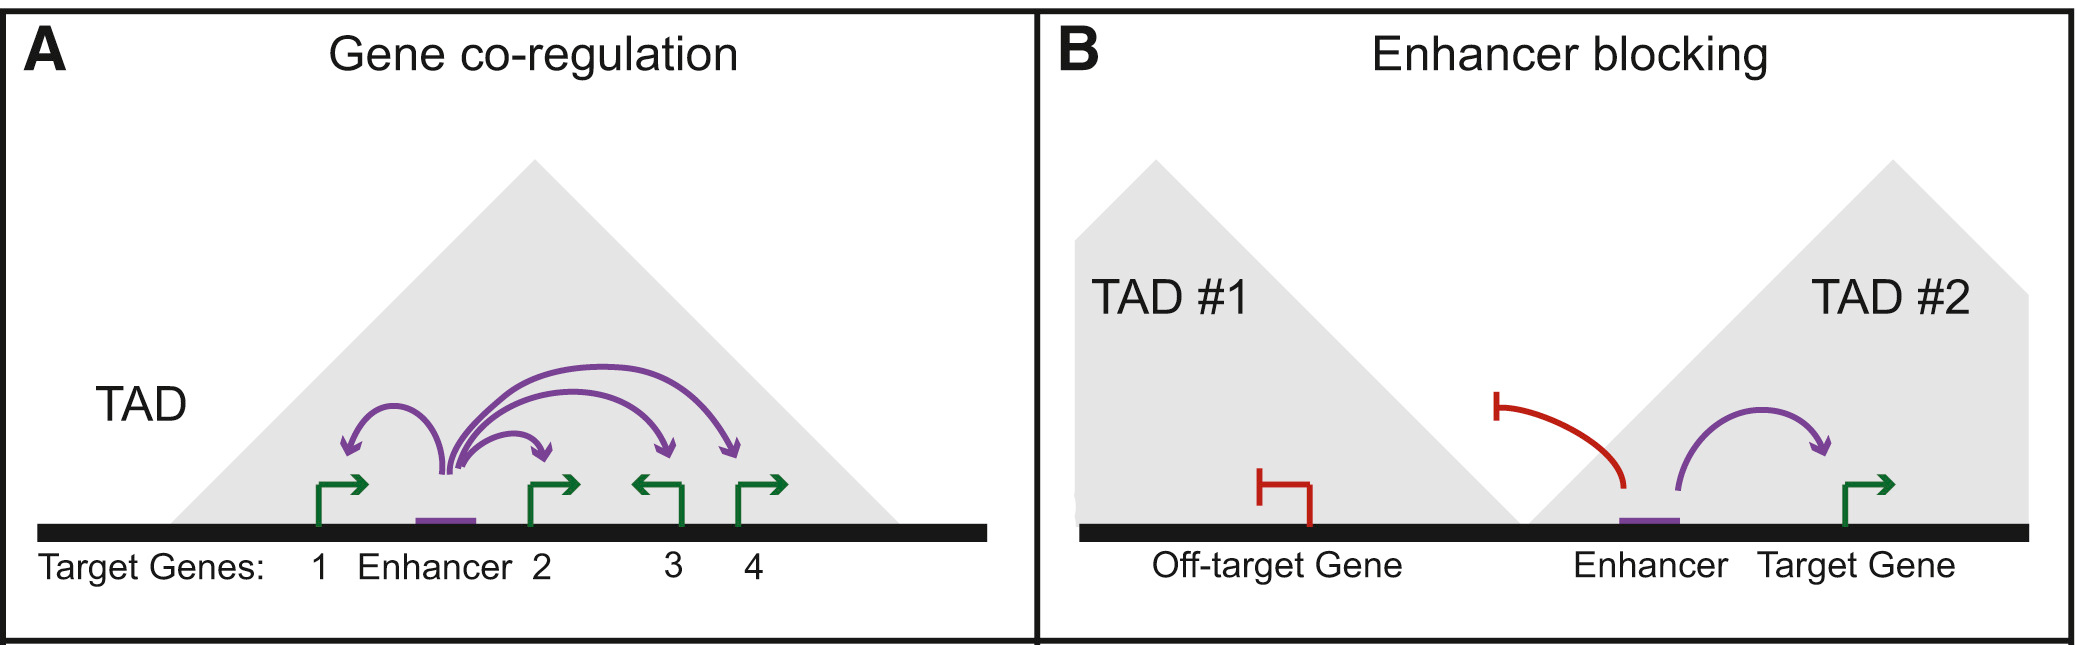
Figure 6.1: Co-regulation by shared enhancers in TADs. (A) Example diagram showing the co-regulation of multiple genes by a single regulatory element within a TAD. (B) Diagram of the potential for TAD boundaries to serve an enhancer blocking role that restricts enhancers to target genes within the same TAD. Figure adapted from (Dixon et al. 2016).

The association of gene expression with gene localizing in TADs is consistent with a very recent computational study with the aim to separate the proportion of expression associated with genome organization from independent sources. A large fraction of expression variance can be attributed to the positioning of genes in genome architecture and is highly informative for TAD activity and organization (Rennie et al. 2018).

Together, with results from many other studies (Bonev and Cavalli 2016; Andrey and Mundlos 2017; Hnisz et al. 2016a), our results support the notion of TADs as functional units of chromosomes in which related genes are co-regulated.