3.2 Results
3.2.1 Identification of evolutionary rearrangement breakpoints from whole-genome alignments
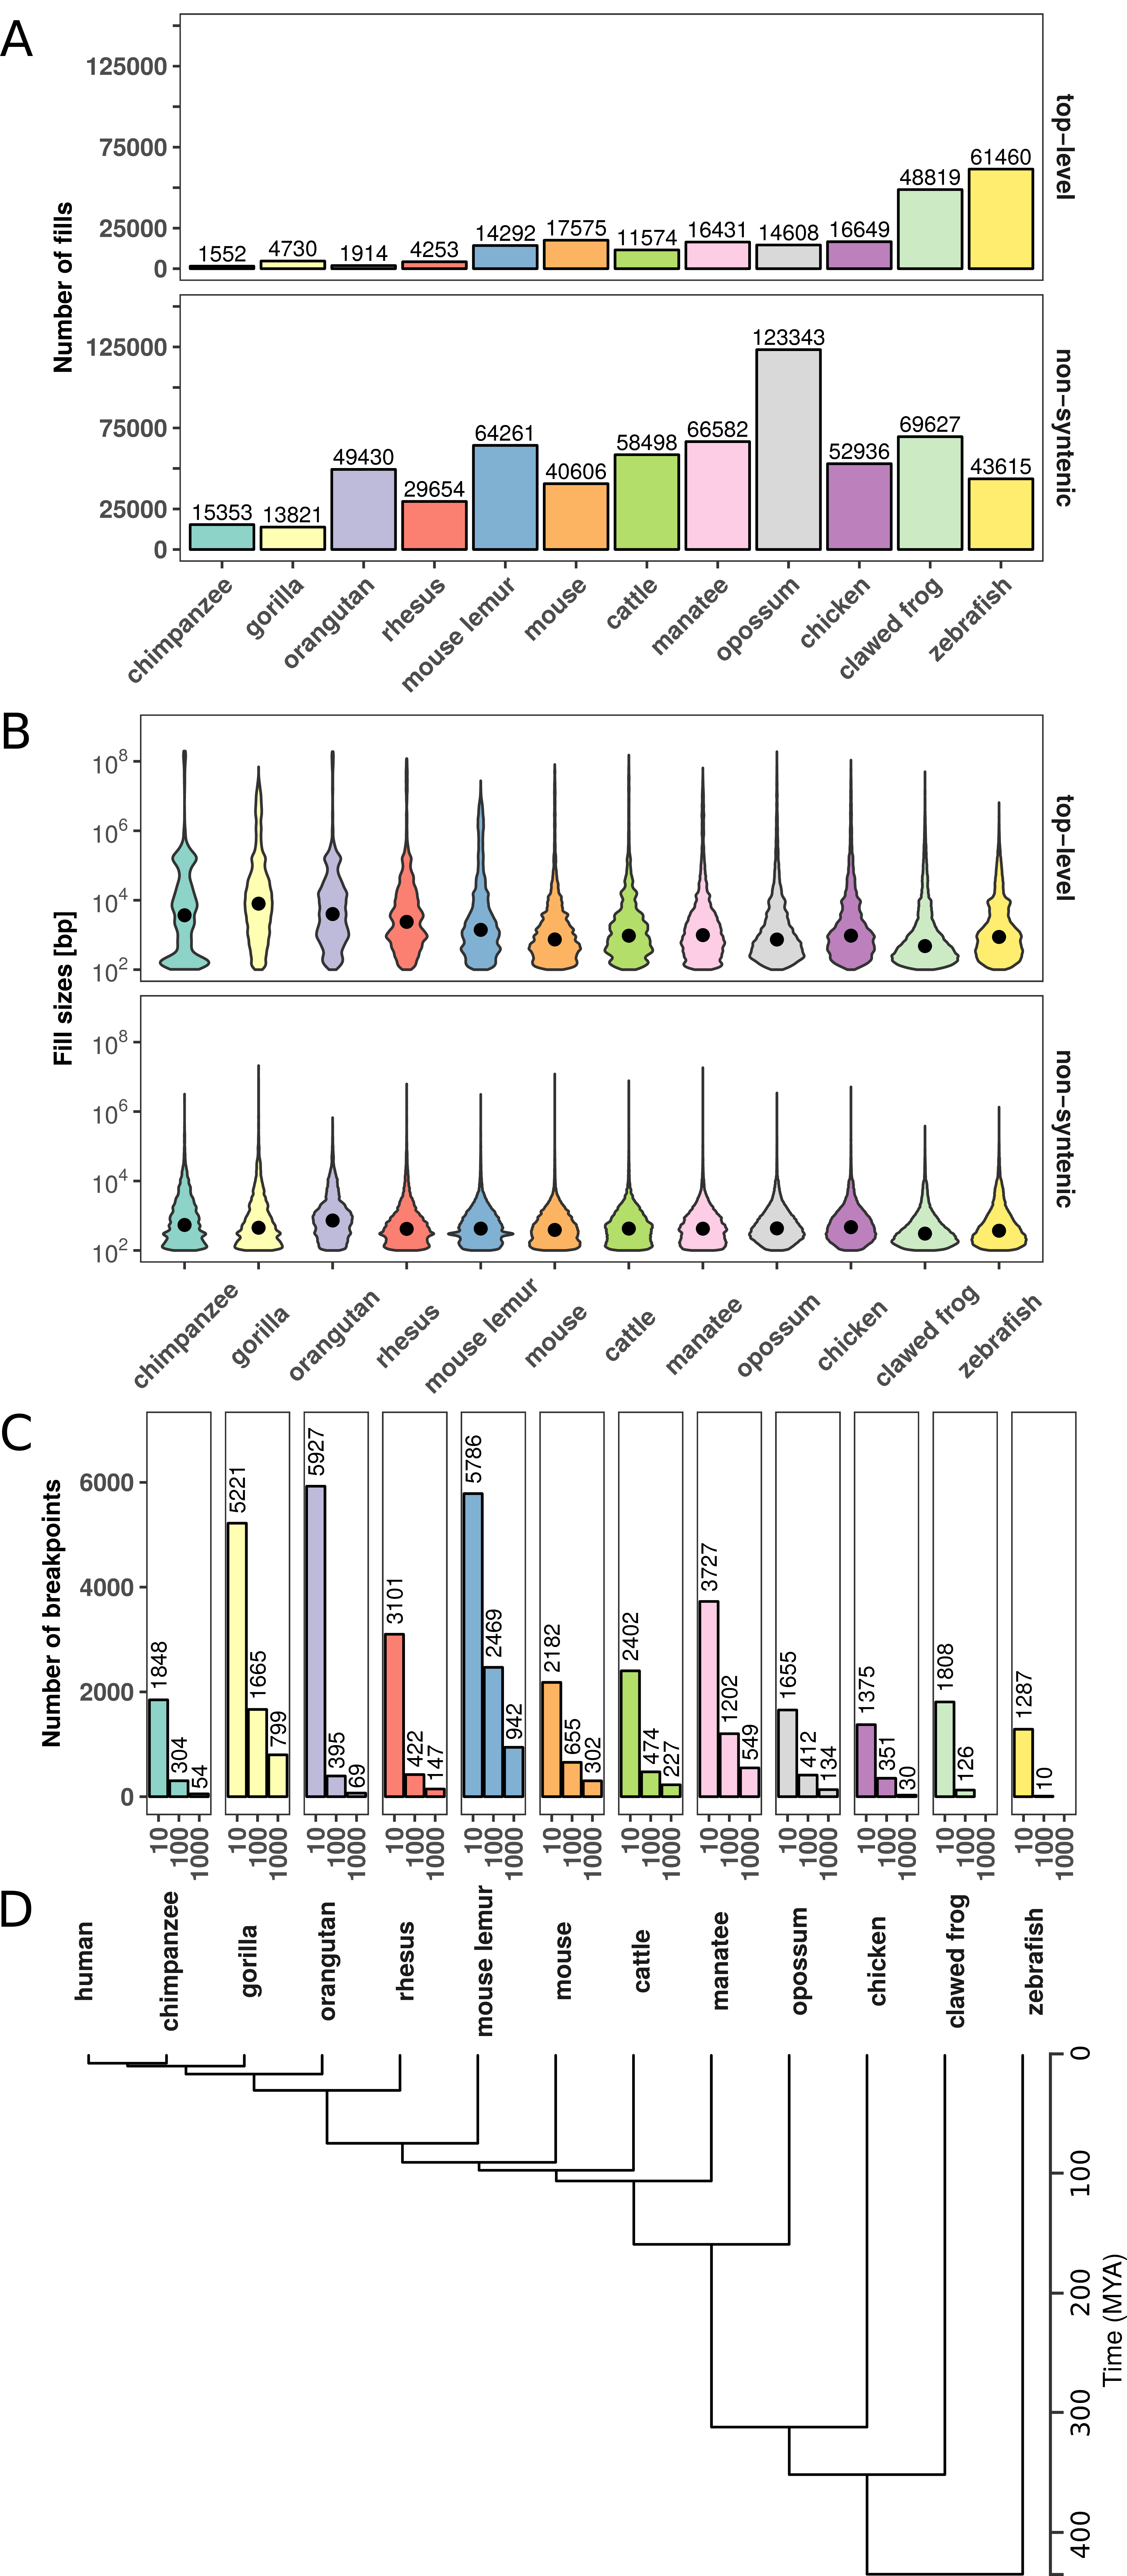
To analyze the stability of TADs in evolution, we first identified evolutionary rearrangements by using whole-genome alignment data from the UCSC Genome Browser (Kent et al. 2003, 2002) to compare the human genome to 12 other species. These species where selected to have genome assemblies of good quality and to span several hundred million years of evolution. They range from chimpanzee to zebrafish (Fig 3.1). The whole-genome data consists of consecutive alignment blocks that are chained and hierarchically ordered into so-called net files as fills (Kent et al. 2003). To overcome alignment artifacts and smaller local variations between genomes we only considered top-level fills or non-syntenic fills and additionally applied a size threshold to use only fills that are larger than 10 kb, 100 kb, or 1000 kb, respectively. Start and end coordinates of such fills represent borders of syntenic regions and were extracted as rearrangement breakpoints for further analysis (see Methods for details).

Figure 3.1: Number and size distributions of fill sizes of whole-genome alignments between human and 12 other species. (A) Number of syntenic alignment blocks (fills) between human (hg38) and 12 other species. Top-level fills are the largest and highest scoring chains and occur at the top level in the hierarchy in net files (top panel). Non-syn fills map to different chromosomes as their parent fills in the net files (bottom panel). (B) Size distribution of top-level (top panel) and non-syntenic (bottom panel) fills as violin plot. (C) Number of identified rearrangement breakpoints between human and 12 other species. Breakpoints are borders of top-level or non-syn fills that are larger or equal than a given size threshold (x-axis). (D) Phylogenetic tree with estimated divergence times according to http://timetree.org/.
First, we analyzed the number and size distributions of top-level and non-syntenic fills between human and other species (Fig 3.1). As expected, closely related species such as chimpanzee and gorilla have in general fewer fills but larger fill sizes (mean length ≥1 kb), whereas species which are more distant to human, such as chicken and zebrafish, tend to have more but smaller fills (mean length ≤ 1 kb, Fig 3.1A,B). However, we also observe many small non-syntenic fills in closely related species, likely arising from transposon insertions (Mills et al. 2006). As a consequence of the number of fills and size distributions, we identify different breakpoint numbers depending on species and size threshold applied. For example, the whole-genome alignment between human and mouse results in 2182, 655, and 302 rearrangement breakpoints for size thresholds, 10 kb, 100 kb, and 1000 kb, respectively (Fig 3.1C). Together, the number and size distributions of syntenic regions reflect the evolutionary divergence time from human and allow us to identify thousands of evolutionary rearrangement breakpoints for enrichment analysis at TADs.
3.2.2 Rearrangement breakpoints are enriched at TAD boundaries
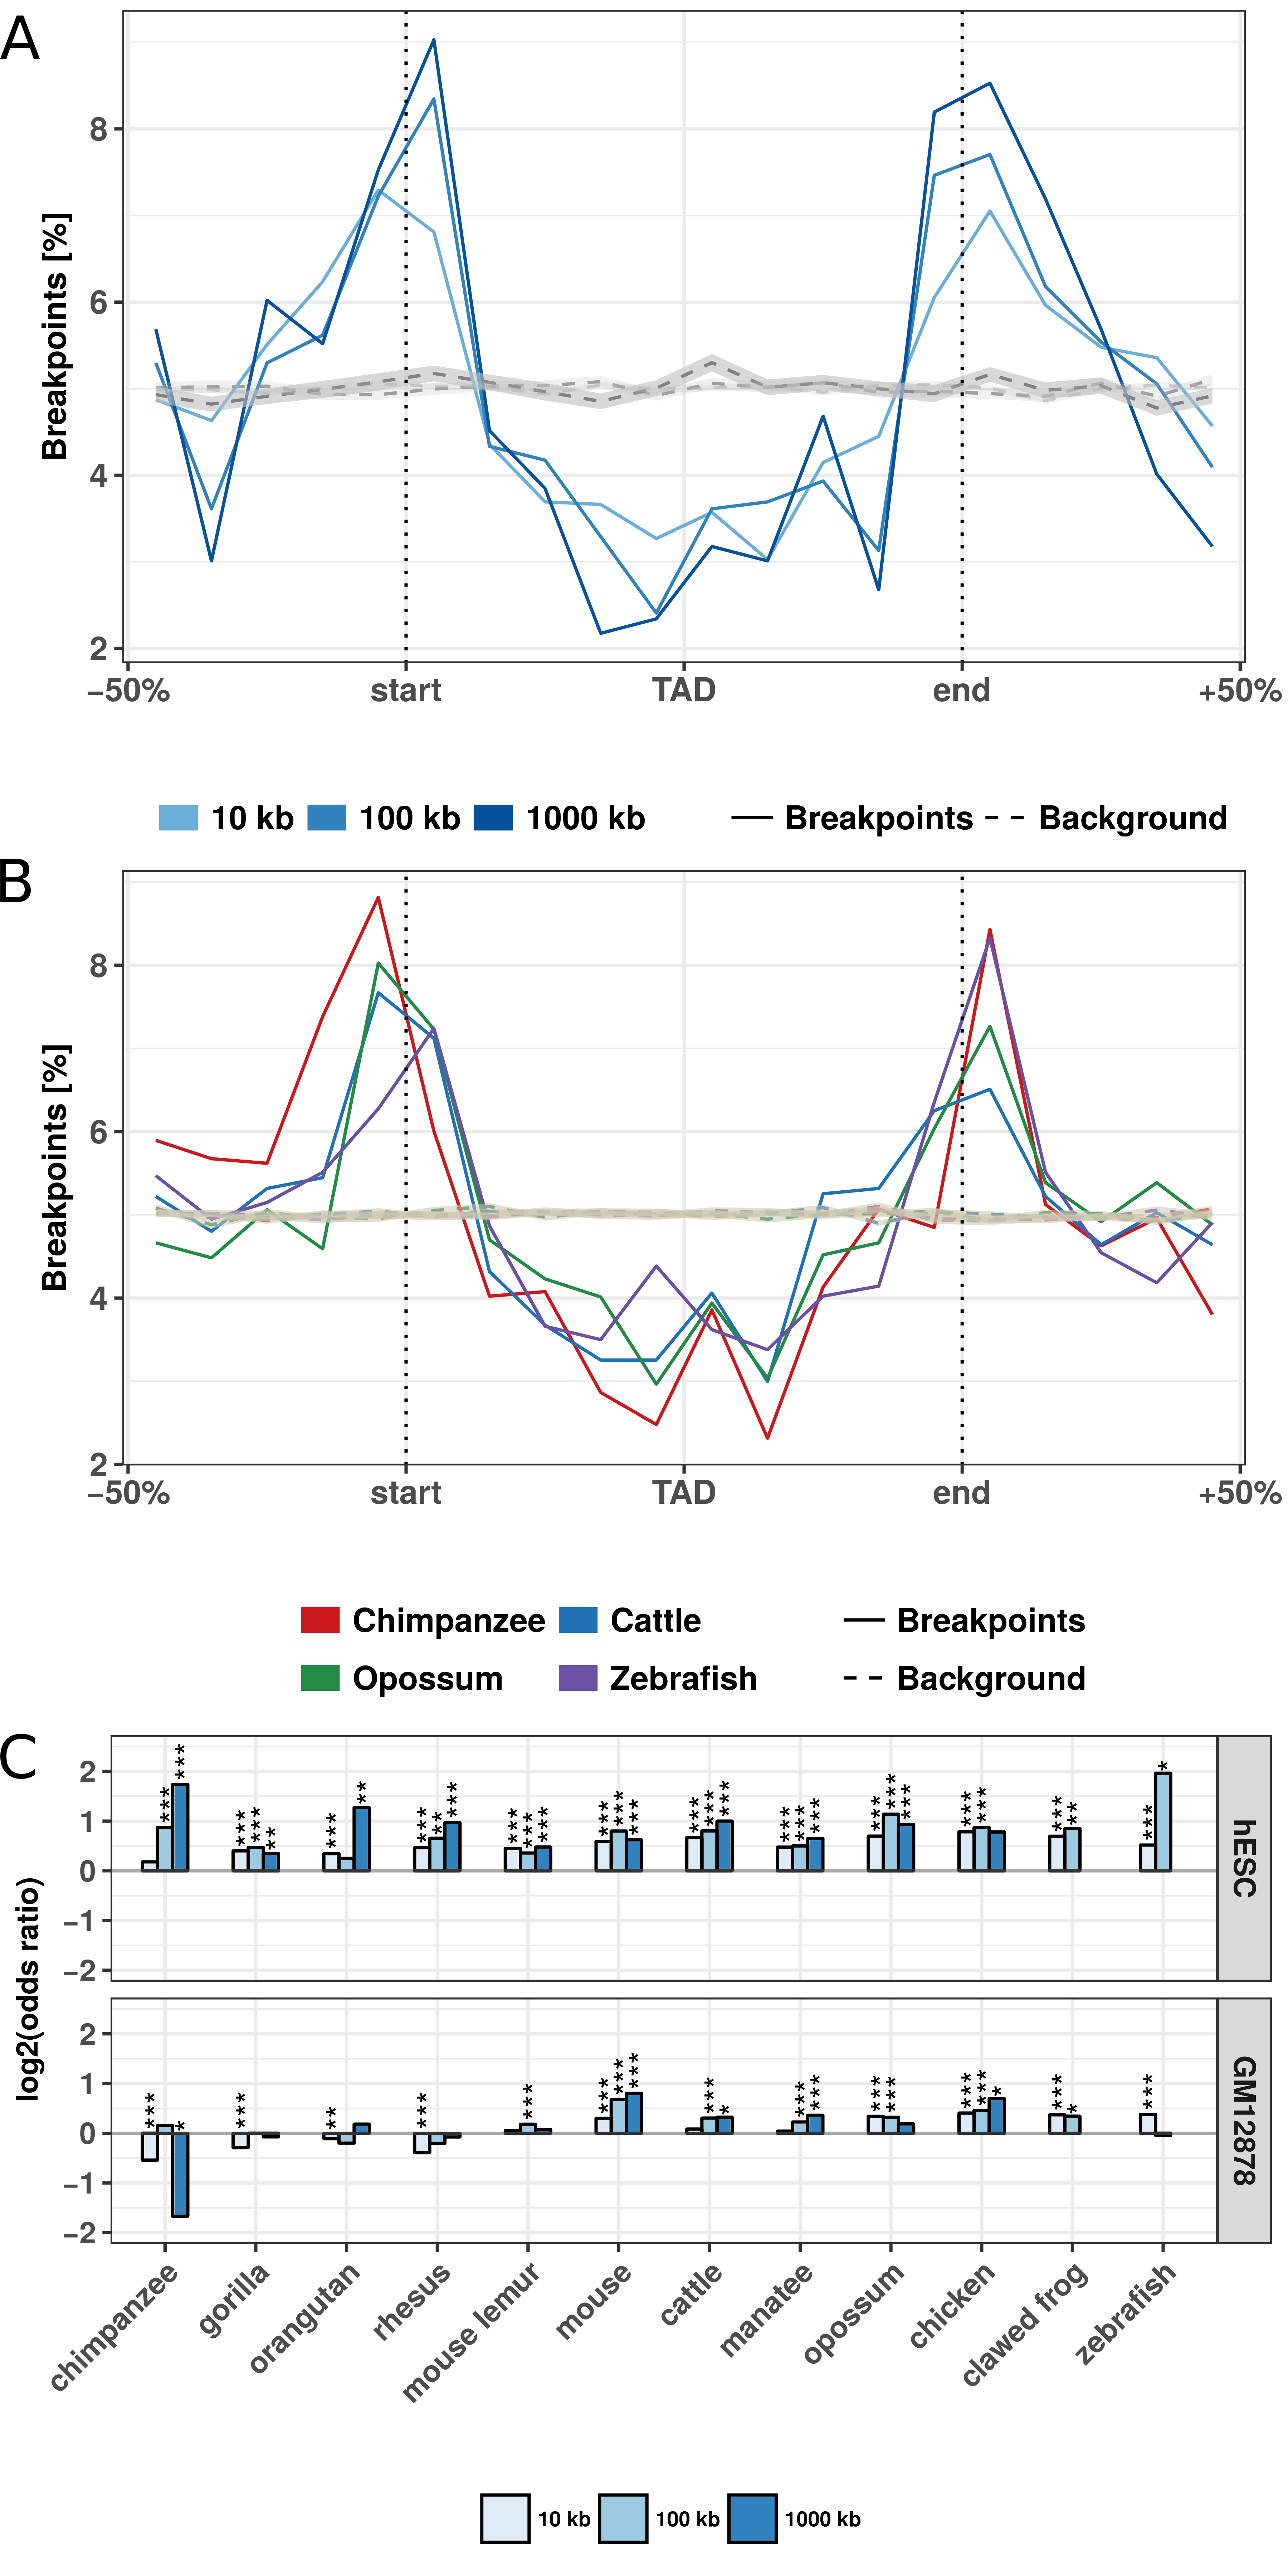
Next, we analyzed how the identified rearrangement breakpoints are distributed in the human genome with respect to TADs. We obtained 3,062 TADs identified in human embryonic stem cells (hESC) (Dixon et al. 2012) and 9,274 contact domains from high-resolution in situ Hi-C in human B-lymphoblastoid cells (GM12878) (Rao et al. 2014). To calculate the number of breakpoints around TADs, we enlarged each TAD region by +/-50% of its size and divided the region in 20 equal sized bins. For each bin we computed the number of overlapping rearrangement breakpoints. This results in a size-normalized distribution of rearrangement breakpoints along TAD regions.

Figure 3.2: Evolutionary rearrangements are enriched at TAD boundaries. (A) Distribution of evolutionary rearrangement breakpoints between human and mouse around hESC TADs. Each TAD and 50% of its adjacent sequence was subdivided into 20 bins of equal size, the breakpoints were assigned to the bins and their number summed up over the corresponding bins in all TADs. Blue color scale represents breakpoints from different fill-size thresholds. Dotted lines in gray show simulated background controls of randomly placed breakpoints. (B) Distribution of rearrangement breakpoints between human and: chimpanzee, cattle, opossum, and zebrafish, at 10 kb size threshold around hESC TADs. Dotted lines in gray show simulated background controls of randomly placed breakpoints. (C) Enrichment of breakpoints at TAD boundaries as log-odds-ratio between actual breakpoints at TAD boundaries and randomly placed breakpoints. Enrichment is shown for three different fill size thresholds (blue color scale) and TADs in hESC from (Dixon et al. 2012) (top) and contact domains in human GM12878 cells from (Rao et al. 2014) (bottom), respectively. Asterisks indicate significance of the enrichment using Fisher’s exact test (*p <= 0.05; **p <= 0.01; ***p <= 0.001).
First, we analyzed the distribution of breakpoints at different size thresholds between human and mouse at hESC TADs (Fig. 3.2A). Rearrangement breakpoints are clearly enriched at TAD boundaries and depleted within TAD regions. Notably, this enrichment is observed for all size thresholds applied in the identification of rearrangement breakpoints. Next, we also analyzed the breakpoints from chimpanzee, cattle, opossum, and zebrafish (Fig 3.2B) at the 10 kb size threshold. Interestingly, we observed for all species a clear enrichment of breakpoints at TAD boundaries and depletion within TAD regions. To quantify this enrichment, we simulated an expected background distribution of breakpoints by placing each breakpoint 100 times at a random position of the respective chromosome. We than calculated the fraction of observed and expected breakpoints that are closer than 40 kb to a TAD boundary. For all size thresholds and analyzed species, we computed the log-fold-ratio of actual breakpoints over random breakpoints at domain boundaries (Fig 3.2C). For virtually all species and size thresholds analyzed, we found breakpoints significantly enriched at boundaries of TADs and contact domains (Fig 3.2C, B.1). Depletion was only observed for some combinations of species and size thresholds which have only very few breakpoints (see Fig 3.1C). Furthermore, we compared the distance of each breakpoint to the closest TAD boundary and observed nearly always significantly shorter distances for actual breakpoints compared to random controls (Fig B.2). Overall, the enrichment was stronger for TADs in hESC compared to the contact domains in GM12878. However, these differences were likely due to different sizes of TADs and contact domains and the nested structure of contact domains, which overlap each other (Rao et al. 2014). Rearrangements between human and both closely and distantly related species are highly enriched at TAD boundaries and depleted within TADs. These results show (i) that rearrangements are not randomly distributed in the genome, in agreement with (Farré et al. 2015), and (ii) strong conservation of TAD regions over large evolutionary time scales, indicating selective pressure against disruption of TADs, presumably because of their functional role in gene expression regulation.
3.2.3 Clusters of conserved non-coding elements are depleted for rearrangement breakpoints
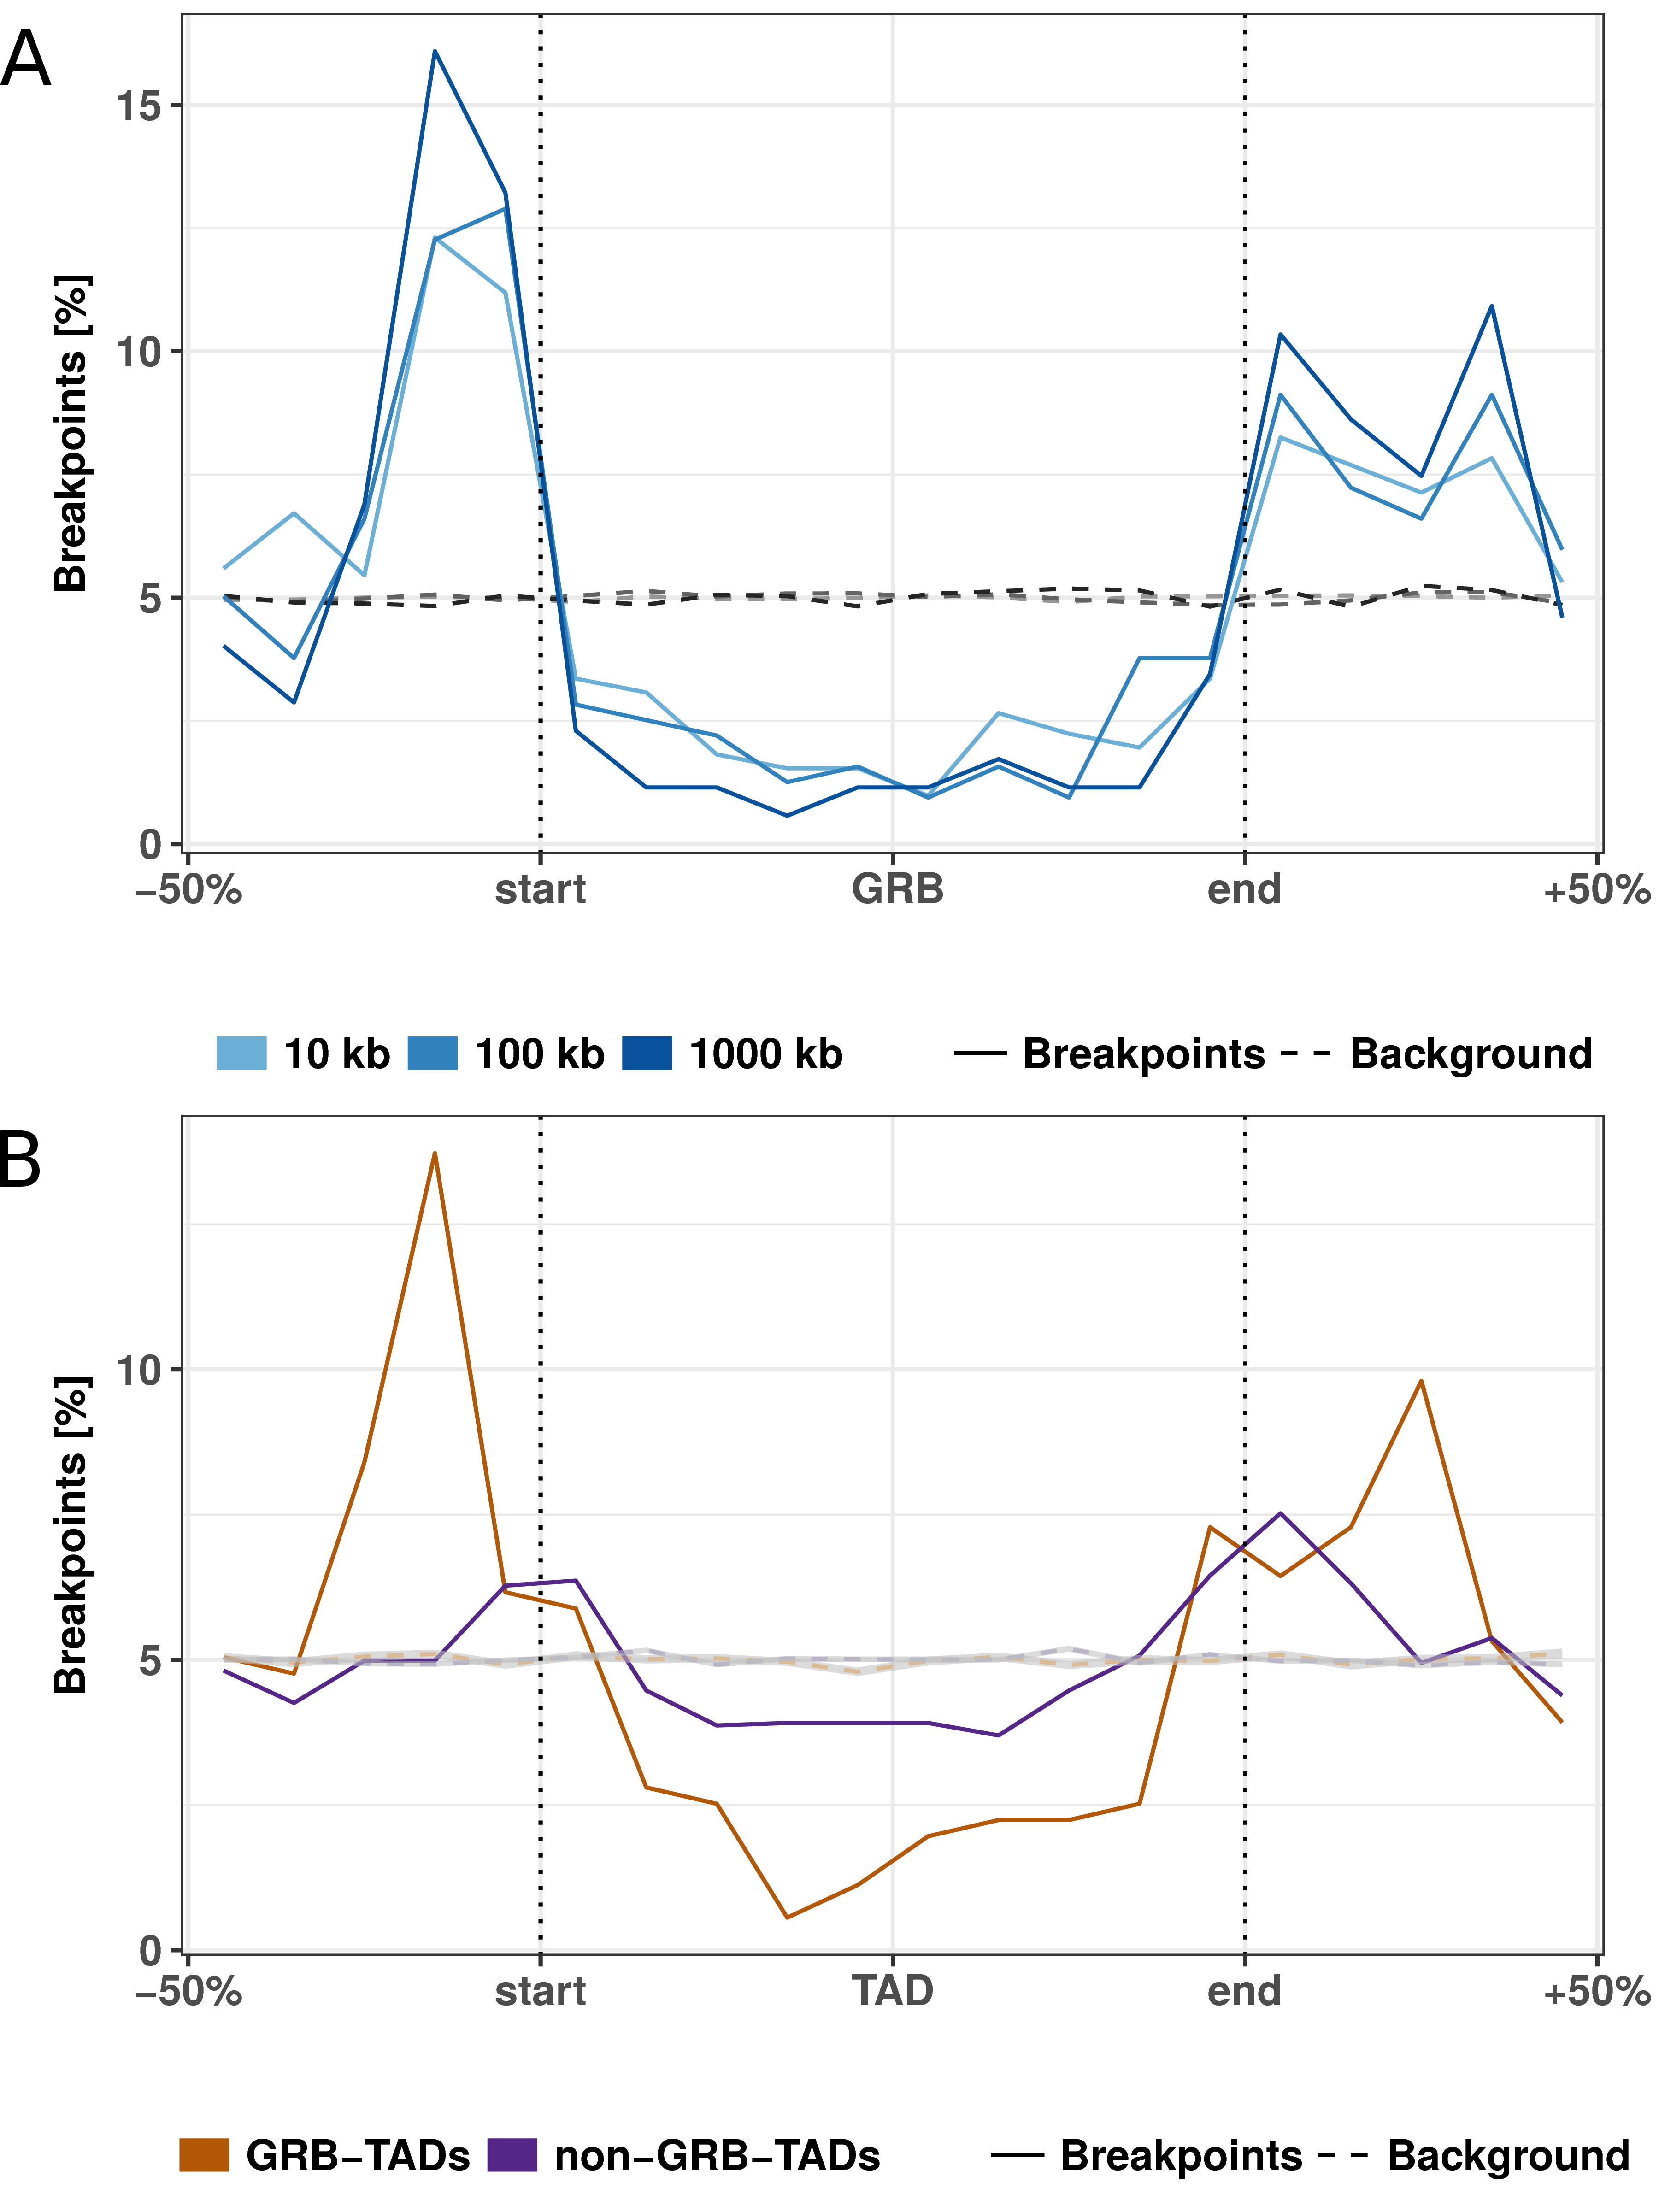
Another interesting feature that can be extracted from whole-genome alignments are highly conserved non-coding elements (CNEs) (Polychronopoulos et al. 2017). CNEs are defined as non-protein-coding sequences of at least 50 bp with over 70% sequence identity between distantly related species such as human and chicken (Polychronopoulos et al. 2017). In the human genome, CNEs cluster around developmental genes in so-called genomic regulatory blocks (GRBs) (Kikuta et al. 2007). It has been shown recently that many GRBs coincide with TADs in human and Drosophila genomes (Harmston et al. 2017). Therefore, we asked whether evolutionary breakpoints are also enriched at boundaries of GRBs. This would support the idea of a conserved regulatory environment around important developmental genes. Indeed we saw a strong enrichment around GRBs (Fig 3.3A). This is consistent with previous studies in Drosophila and Fish where CNE arrays often correspond to syntenic blocks (Engström et al. 2007; Dimitrieva and Bucher 2013).

Figure 3.3: Rearrangement breakpoint distribution around GRBs and GRB-TADs. (A) Rearrangement breakpoints between mouse and human around 816 GRBs. (B) Breakpoint distribution around GRB-TADs and non-GRB-TADs. GRB-TADs are defined as TADs overlapping more than 80% with GRBs and non-GRB-TADs have less than 20% overlap with GRBs. Breakpoints using a 10 kb fill size threshold are shown.
Next, we subdivided TADs according to their overlap with GRBs in GRB-TADs (> 80% overlap) and non-GRB-TADs (< 20% overlap) as in the original study (Harmston et al. 2017). As expected, we observed a higher accumulation of breakpoints at boundaries and stronger depletion within TADs for GRB-TADs compared to non-GRB-TADs (Fig 3.3B). However, also the non-GRB-TADs, that have less than 20% overlap with GRBs, are enriched for rearrangements at TAD boundaries. This indicates that not only TADs overlapping GRBs are evolutionary conserved. In summary, we show that human TADs overlapping clusters of non-coding conserved elements are strongly depleted for rearrangements, likely due to strong selective pressure on the conserved regulatory environment around important developmental genes.
3.2.4 Rearranged TADs are associated with divergent gene expression between species
The enrichment of rearrangement breakpoints at TAD boundaries indicates that TADs are stable across large evolutionary time scales. However, the reason for this strong conservation of TAD regions is unclear. A mechanistic explanation could be that certain chromatin features at TAD boundaries promote or prevent DNA double strand breaks (DSBs) (Farré et al. 2015; Canela et al. 2017). Alternatively, selective pressure might act against the disruption of TADs due to their functional importance, for example in developmental gene regulation (Nora et al. 2013; Farré et al. 2015). TADs constitute a structural framework determining possible interactions between promoters and cis-regulatory sequences while prohibiting the influence of other sequences (Symmons et al. 2014; Lupiáñez et al. 2015). TAD disruption would prevent formerly established contacts. Rearrangements of TADs might also enable the recruitment of new cis-regulatory sequences which would alter the expression patterns of genes in rearranged TADs (Lupiáñez et al. 2015; Redin et al. 2017). Because of these detrimental effects, rearranged TADs should largely be eliminated by purifying selection. However, rearrangement of TADs could also enable the expression of genes in a new context and be selected if conferring an advantage. Therefore, we hypothesized that genes within conserved TADs might have a more stable gene expression pattern across tissues, whereas genes in rearranged TADs between two species might have a more divergent expression between species.
To test this, we analyzed the conservation of gene expression of ortholog genes between human and mouse across 19 matched tissues from the FANTOM5 project (Table S1) (Forrest et al. 2014). If a human gene and its mouse ortholog have high correlation across matching tissues, they are likely to have the same regulation and eventually similar functions. Conversely, low correlation of expression across tissues can indicate functional divergence during evolution, potentially due to altered gene regulation.
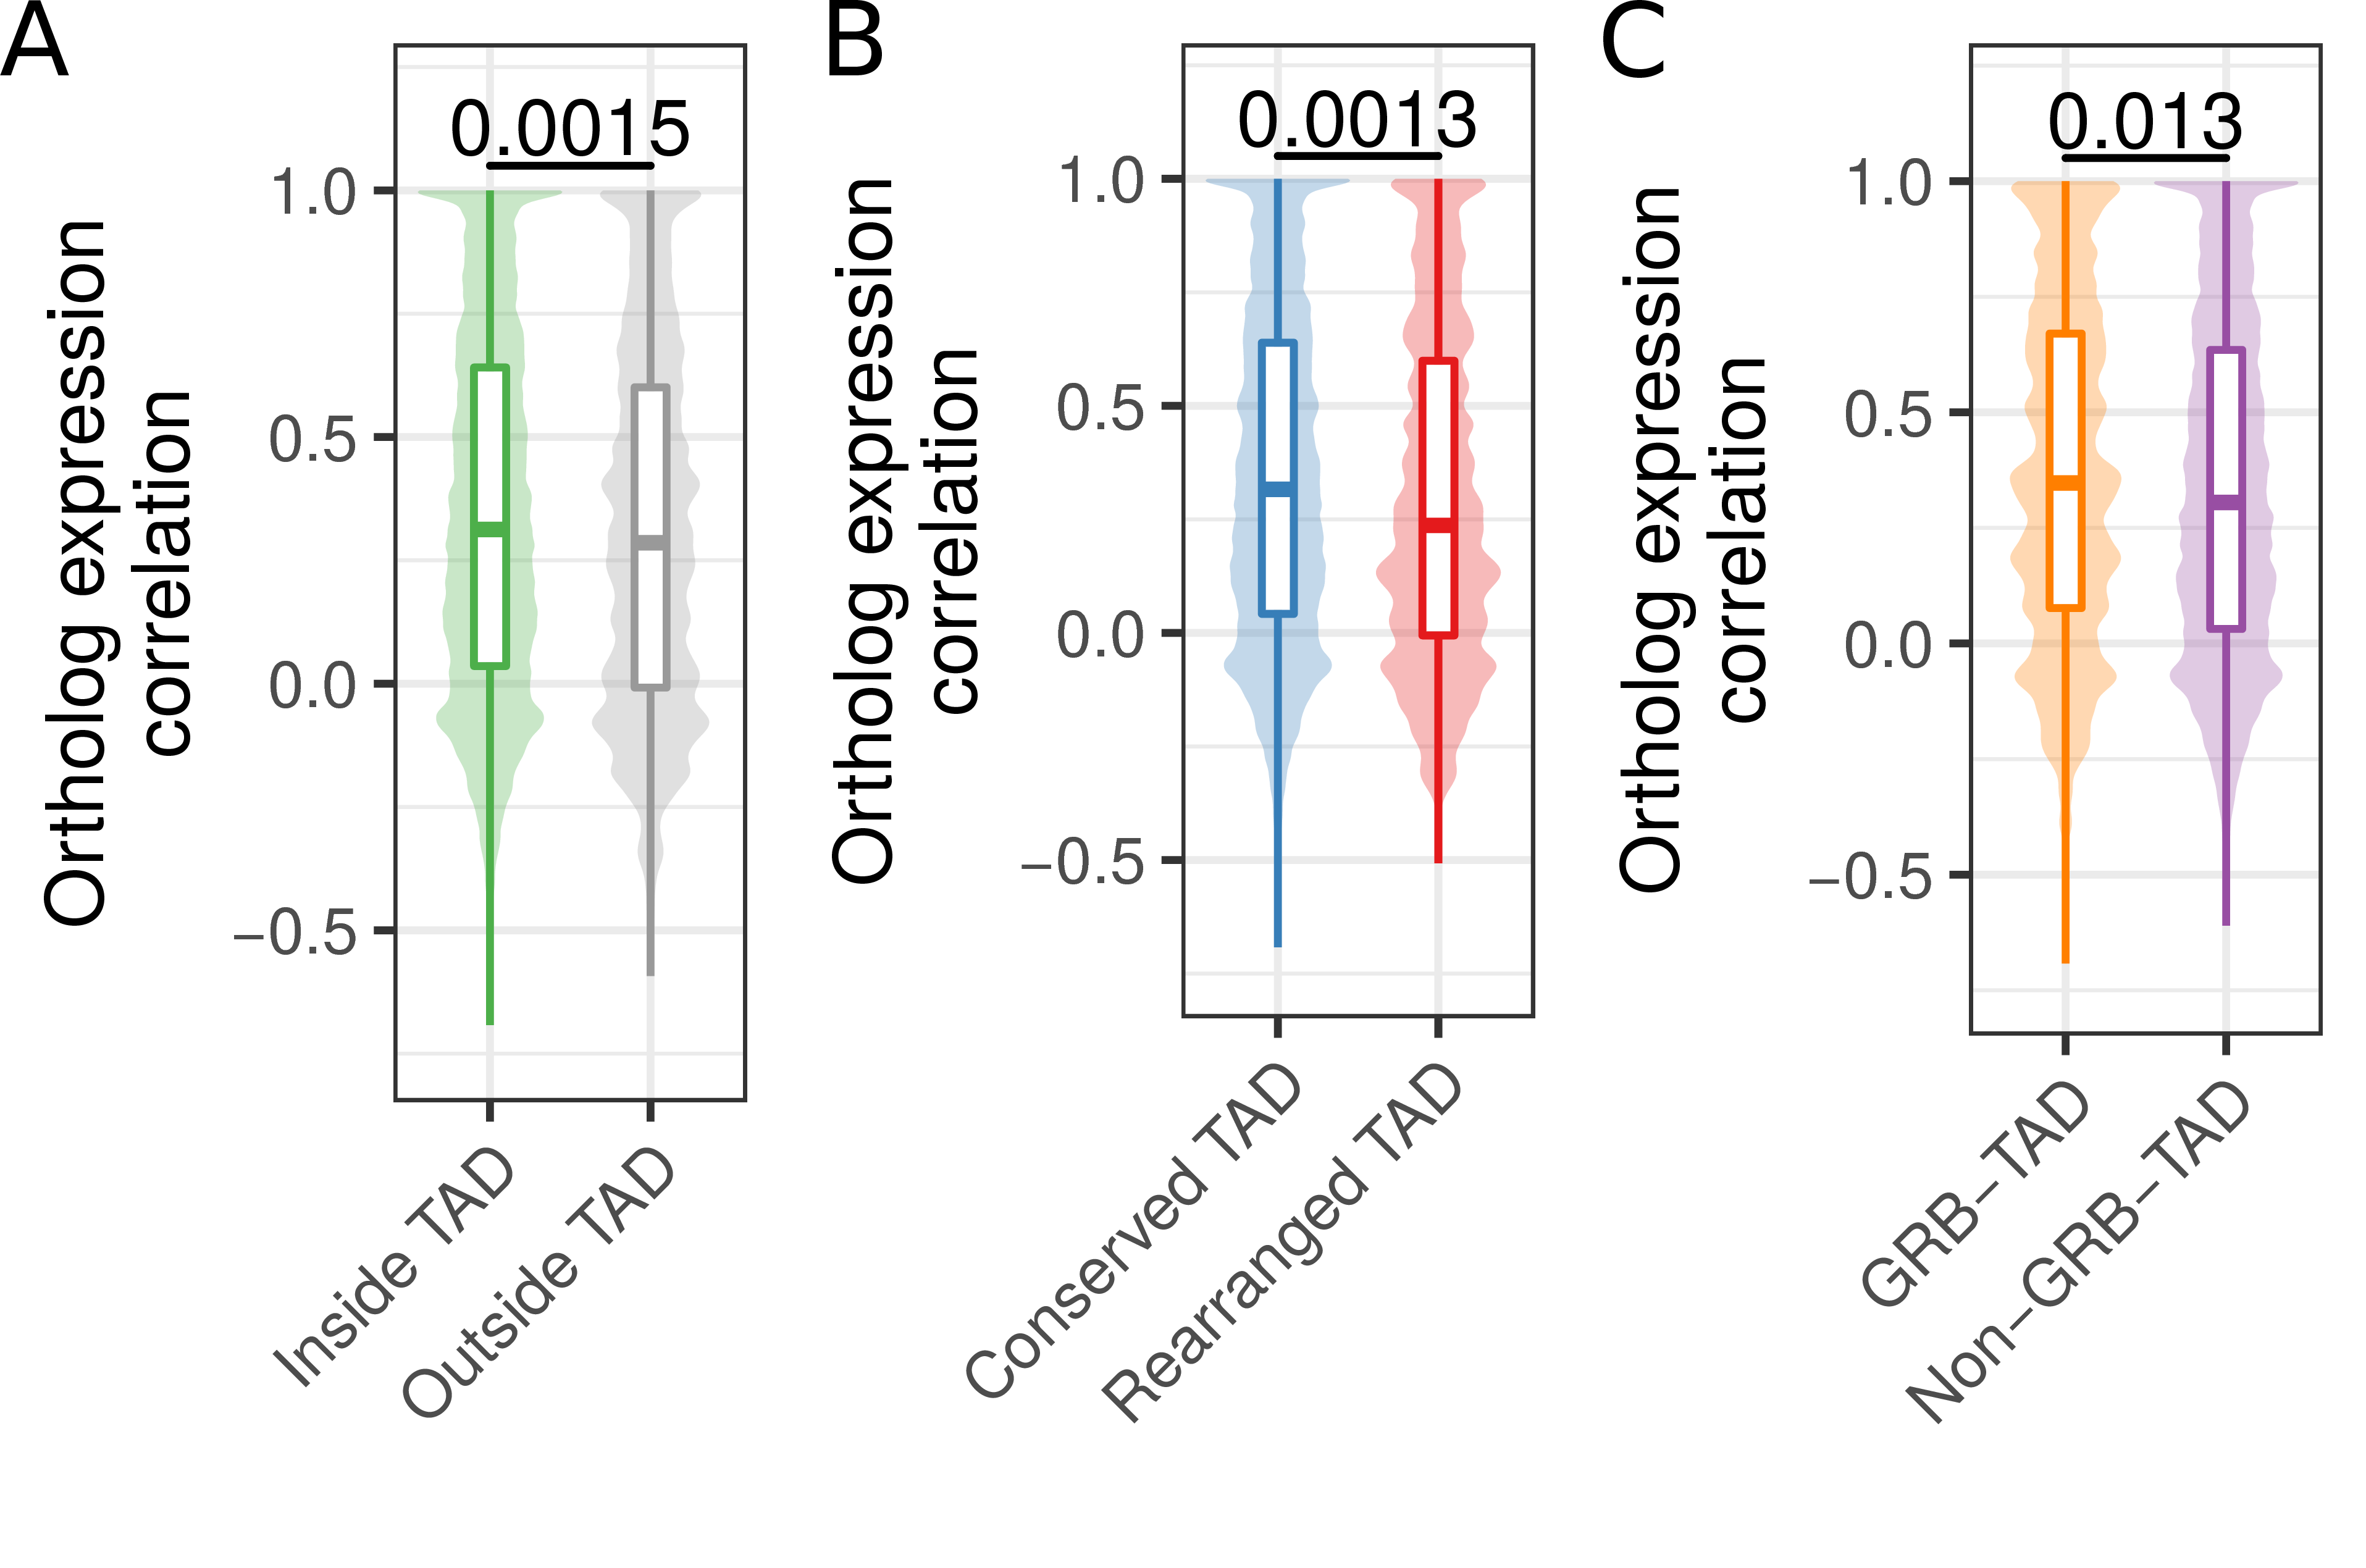
First, we separated human genes according to their location within TADs or outside of TADs. From 12,696 human genes with expression data and a unique one-to-one ortholog in mouse (Table S2), 1,525 have a transcription start site (TSS) located outside hESC TADs and 11,171 within. Next, we computed for each gene its expression correlation with mouse orthologs across 19 matching tissues. Genes within TADs have significantly higher expression correlation with their mouse ortholog (median R = 0,340) compared to genes outside TADs (mean R = 0,308, p = 0.0015, Fig 3.4A). This indicates higher conservation of gene regulation in TADs and is consistent with the observation of housekeeping genes at TAD boundaries (Dixon et al. 2012) and the role of TADs in providing conserved regulatory environments for gene regulation (Harmston et al. 2017; Ibn-Salem et al. 2017).

Figure 3.4: Ortholog gene expression correlation across tissues in conserved and rearranged TADs. (A) Expression correlation of orthologs across 19 matching tissues in human and mouse for human genes within or outside of hESC TADs. (B) Expression correlation of orthologs across 19 matching tissues in human and mouse for genes in conserved or rearranged TADs. (C) Expression correlation of orthologs across 19 matching tissues in human and mouse for genes in GRB-TADs and non-GRB TADs. All P-values according to Wilcoxon rank-sum test.
Next, we further subdivided TADs in two groups, rearranged and conserved, according to syntenic blocks and rearrangements between human and mouse genomes. In brief, a TAD is defined as conserved, if it is completely enclosed by a syntenic alignment block and does not overlap any rearrangement breakpoint. Conversely, a rearranged TAD is not enclosed by a syntenic alignment block and overlaps at least one breakpoint that is farther than 80 kb from its boundary (see Methods). For the hESC TAD data set, this leads to 2,542 conserved and 137 rearranged TADs. The low number of rearranged TADs is consistent with the depletion of rearrangement breakpoints within TADs in general (Fig. 2). In total 8,740 genes in conserved and 645 genes in rearranged TADs could be assigned to a one-to-one ortholog in mouse and are contained in the expression data set. The expression correlation with mouse orthologs were significantly higher for genes in conserved TADs (median R = 0.316) compared to genes in rearranged TADs (median R = 0.237, p = 0.0013) (Fig 3.4B). This shows that disruptions of TADs by evolutionary rearrangements are associated with less conserved gene expression profiles across tissues. Although not significant, we also observed a slightly higher expression correlation for 1,003 genes in GRB-TADs compared to 8,038 genes in non-GRB TADs (Fig 3.4C, p = 0.13).
In summary, we observed higher expression correlation between orthologs
for human genes inside TADs than outside. Moreover, we saw that genes in
rearranged TADs show lower gene expression conservation than those in
conserved TADs. These results not only support a functional role of TADs
in gene regulation, but further support the hypothesis that TAD regions
are subjected to purifying selection against their disruption by
structural variations such as rearrangements.