4.3 Results
4.3.1 Genomic characterization of non-coding breakpoints
To study the structural and evolutionary context of BCAs and their impact on nuclear architecture and gene expression, we used data generated by DGAP,(Higgins et al. 2008; Ligon et al. 2005; Kim and Marcotte 2008; Lu et al. 2007; Redin et al. 2017) the largest collection of sequenced balanced chromosome rearrangements from individuals with abnormal developmental and cognitive phenotypes, many of which have yet to be investigated in detail. Each studied DGAP BCA has two breakpoint positions (as two distinct chromosome regions are involved in their generation), which we labeled with the DGAP#_A and DGAP#_B identifiers. We filtered DGAP data to select cases with both breakpoints in non-coding regions only, and excluding lincRNAs and pseudogenes; a total of 17 cases fulfilled our criteria, 15 translocations and 2 inversions (Figure 4.1 and Table S1). These subjects are phenotypically distinct, and most of them presented with congenital developmental and neurological conditions not recognized as a known syndrome or genomic disorder (see clinical descriptions in Supplemental Note: Case Reports).
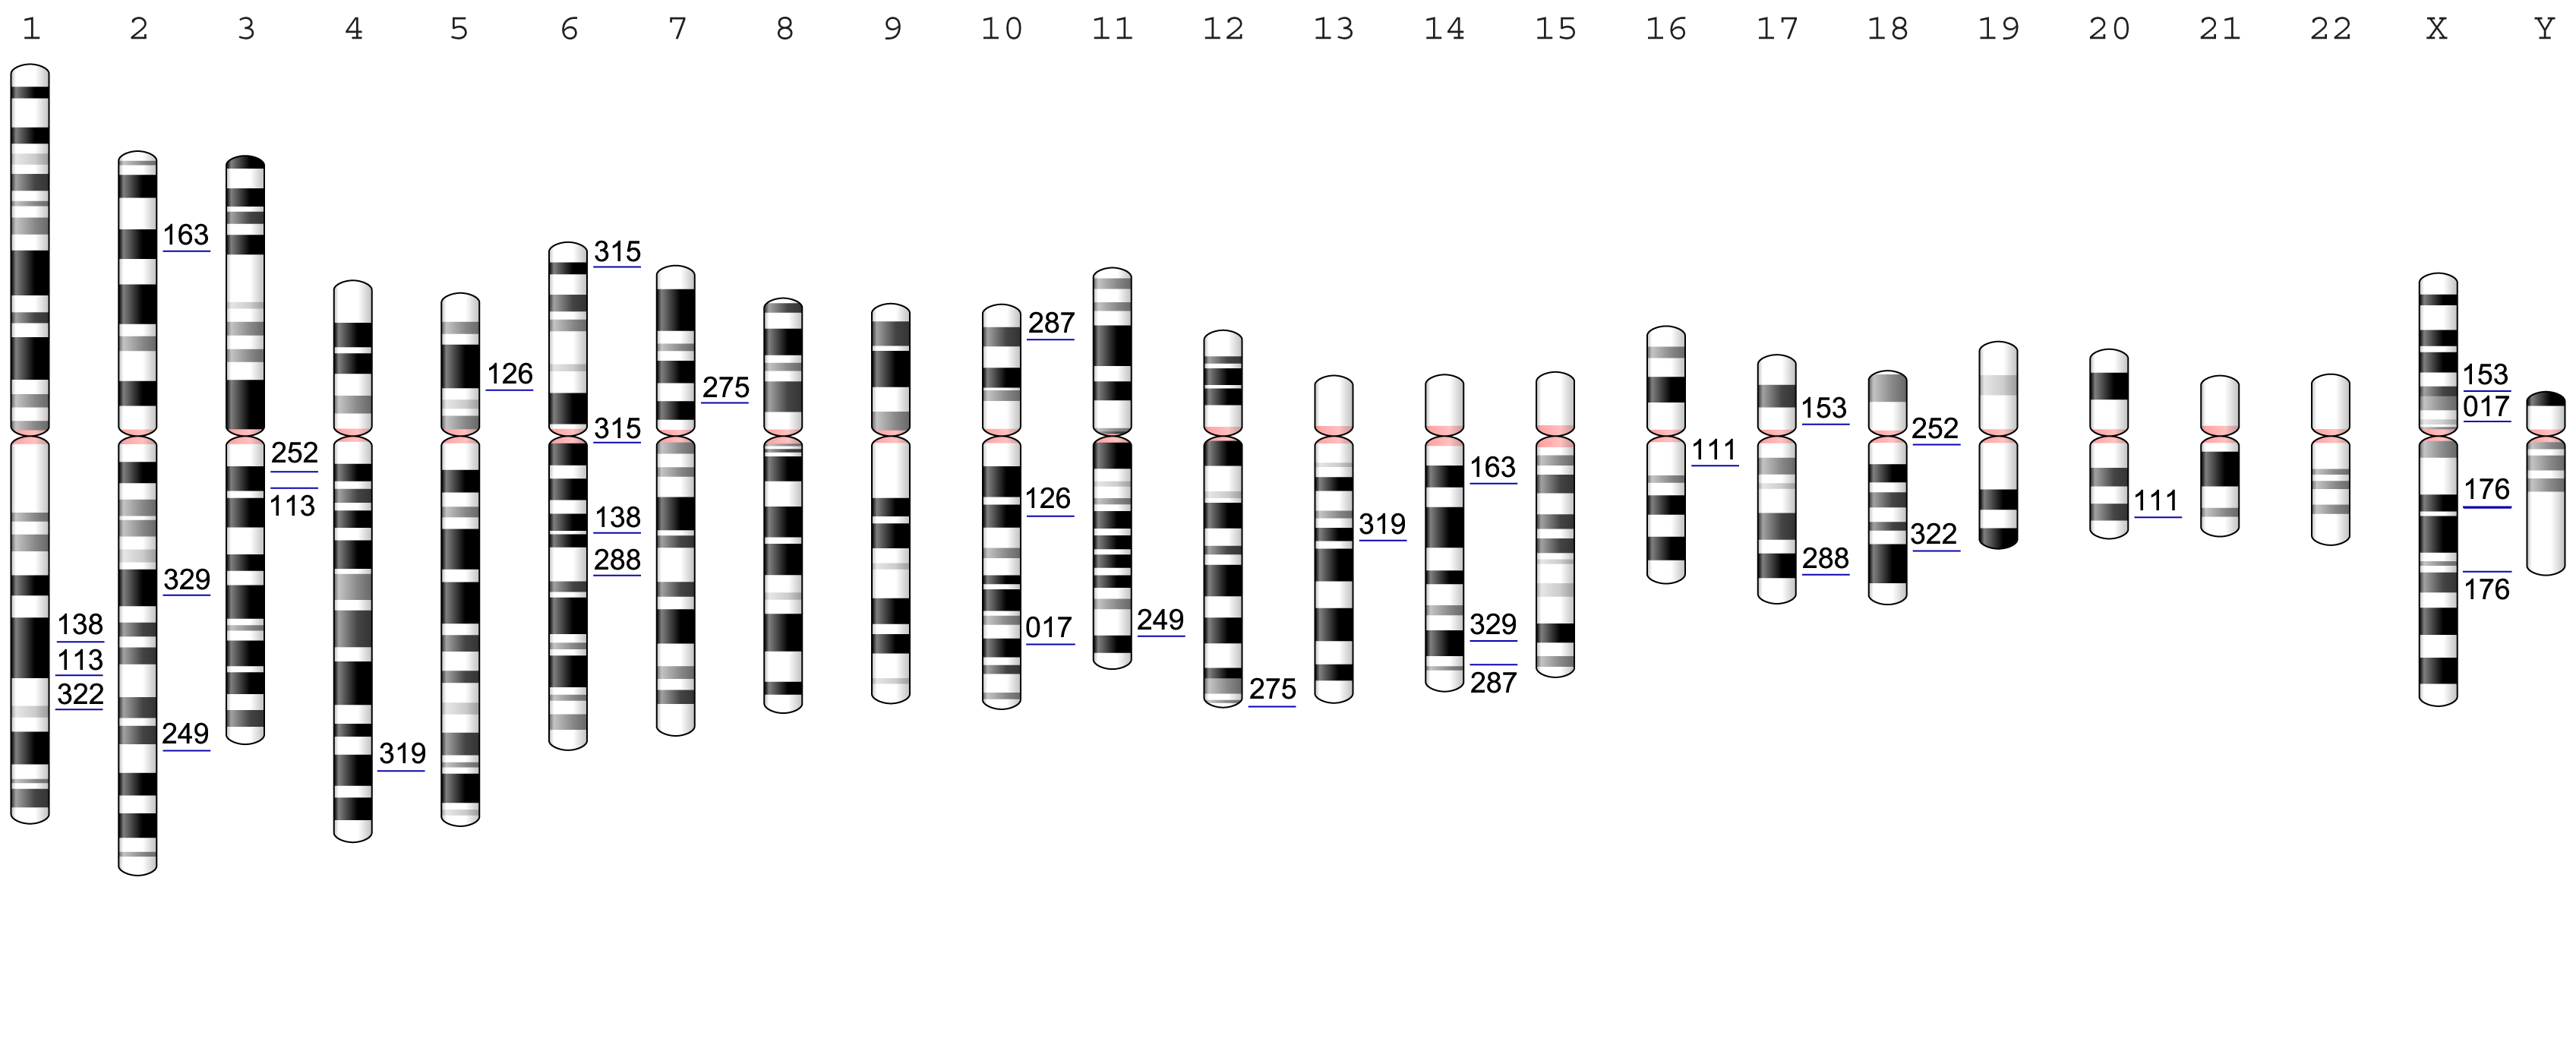
Figure 4.1: Chromosome locations of the 17 analyzed DGAP cases with non-coding BCAs. Breakpoint positions are marked with a blue line and the corresponding DGAP number. All chromosomes are aligned by the centromere (marked in pink) and are indicated above by their corresponding chromosome number.
Further analysis revealed that BCA breakpoints were significantly depleted for overlapping annotated promoters or transcription factor (TF) binding sites (GAT TF p=0.0003, promoter p=0.0001, Table S2,3). Only one breakpoint (DGAP249_B) overlapped a ChromHMM enhancer in GM12878 cells (Table 4.1); the others had no overlap with annotated or predicted enhancers in the analyzed datasets, and this depletion was significant for VISTA (GAT p=0.0364) and Hi-ESC (GAT p=0.0036) but not for the annotated tissue and primary cell enhancers from Andersson et al., 2014(Andersson et al. 2014) (Table S4). Eight breakpoints overlapped cell-type specific DHS sites (Table 4.1 and Table S5); these corresponded to DGAP cases 017, 176, 249, 275, 288 and 322; of these, DGAP176 and DGAP275 overlapped DHS sites at both BCA breakpoint sites. In addition, three DGAP cases overlapped CTCF binding sites in H1-hESC (DGAP cases 111, 176, and 287) and none in GM12878 cells (Table 4.1 and Table S6). Except for two cases in H1-hESC (DGAP17 and DGAP176), and four cases in GM12878 (DGAP 017, 126, 163 and 176), all rearrangements fall within ChromHMM repressed chromatin regions, but this association was not significant (GAT p= 0.40 for GM12878 and p= 0.15 for H1-hESC, Table S2F). Interestingly, 22 of the 34 breakpoints (~65%) overlap repeated elements at a significant level (GAT p=0.0002, Table S8), which may indicate a non-allelic homologous recombination process in their generation.(Gu et al. 2008; Cardoso et al. 2016)
Noticeably, either one or two breakpoints from all the non-coding DGAP BCAs fall within previously reported TADs in H1-hESC and IMR90 cell lines (Table 4.1 and Table S9).(Dixon et al. 2012) However, this overlap was not significant for both cell lines (GAT H1-ESC p=0.0537 and IMR90 p=0.28). We found that the breakpoints disrupt dozens, hundreds, or even thousands of chromatin contacts when assessed at the 20 and 40 Kb resolution in Hi-C data of H1-hESC and IMR90 cells, as well as chromatin contacts at 100 Kb and 1 Mb resolution in GM06990 cells (Table S11). Breakpoint DGAP111_A had a consistent absence of disrupted chromatin contacts, which is expected as it overlaps a repetitive satellite region so no chromatin contacts could be mapped to the segment (Table S9 and Table S11). With the availability of higher resolution data, it is possible to detect whether BCA breakpoints disrupt smaller chromatin domains and loops not detected in previous studies. When analyzing high resolution IMR90 and GM12878 Hi-C data,(Rao et al. 2014) we discovered that 32 out of 34 breakpoints are contained within GM12878 sub-compartments (Table 4.1 and Table S10); interestingly, 28 of these are classified as members of the B compartment, which is less gene dense and less expressed compared to the A compartment. On the other hand, 18 and 24 breakpoints are contained within GM12878 and IMR90 arrowhead domains, respectively (Table S10), which are regions of enhanced contact frequency that tile the diagonal of each chromatin contact matrix. In addition, the breakpoints disrupt several significant short and long-range chromatin interactions in the GM12878 Hi-C data (Table S12).
Overall, the observation of breakpoint-associated DHS sites suggests the alteration of underlying regulatory elements with potential pathogenic outcomes, while the predicted extensive disruption of chromatin contacts and the alteration of TAD boundaries by the BCAs may affect long-range regulatory interactions of neighboring genes (see Discussion).
4.3.2 Identification of genes with potential position effects
To identify genes which could be generating the complex DGAP phenotypes via position effects from chromosome rearrangements, we analyzed all annotated genes within windows of +-3 and +-1 Mb proximal and distal to the breakpoints, and within the BCA-containing H1-hESC reported TAD positions. A total of 3081 genes were contained within the +-3 and +-1 Mb windows for all cases; 106 of these genes (~3.4%) have an HI score of <10%, which is a predictor of haploinsufficiency,(Huang et al. 2010) and 55 and two genes have ClinGen emerging evidence suggesting that dosage haplo/triplo-sensitivity, respectively, is associated with clinical phenotype (Table S15).
To further refine our search for genes which may exhibit position effects, we performed an unbiased correlation between DGAP case phenotypes and the clinical traits associated with genes bordering each breakpoint. To this end, we used the HPO dataset,(Köhler et al. 2014) which provides a standardized vocabulary of phenotypic abnormalities encountered in human disease, and currently contains ~11,000 terms and over 115,000 annotations to hereditary diseases. We translated DGAP clinical features to HPO terms (Table S16), and calculated phenotype similarity between DGAP cases and neighboring genes using the phenomatch score.(Ibn-Salem et al. 2014) The phenomatch score distinguishes between general and very specific phenotypic descriptions by quantifying the information content of the most specific HPO terms that are common to, or a common ancestor of, the DGAP case and neighboring gene phenotypes. The similarity significance is then calculated based on randomly permuting the associations of phenotypes to genes, and in shifting the DGAP translocation and inversion breakpoint positions along the chromosome. We obtained phenomatch scores ranging from 0.003 to 91.48 for 179 genes within the +-3 and +-1 Mb windows, as well as within the TAD positions (Table S15).
In addition to dosage sensitivity and phenotypic similarity information, we complemented our analysis with assessment of enhancer-promoter interactions to make our candidate selection more specific. A typical mechanism by which chromosome rearrangements cause position effects is through disruptions in the association of genes with their regulatory regions.(Kleinjan and Van Heyningen 2005; Kleinjan and Heyningen 1998) We therefore reasoned that genes and enhancers included in predicted enhancer-promoter interactions would be strong position effect candidates. We used the ENCODE distal DHS/enhancer–promoter connections(Thurman et al. 2012) to assess disrupted predicted cis-regulatory interactions by the DGAP breakpoints within a +-500 Kb window. The analysis revealed 193 genes that were separated from their predicted candidate enhancers, potentially altering gene expression (Table S13). A total of 133 candidate genes were separated from <10 of their predicted enhancers, while 60 genes were separated from their predicted interactions with 10 or up to 91 enhancers (Table S14).
For the 17 analyzed DGAP BCAs, there are a total of 645 genes with either evidence of dosage sensitivity, disrupted enhancer-promoter interactions, or significant phenotypic similarity. This represents ~21% of the genes contained within the +-3 Mb windows, clearly an undesirable number for timely clinical interpretation and functional analyses. To filter the most promising candidates, we ranked them using their reported dosage sensitivity, disrupted regulatory interactions, and by selecting a phenomatch cut-off value capable of detecting pathogenic and likely pathogenic genes in 57 published DGAP cases from Redin et al., 2017.(Redin et al. 2017) By taking into consideration the top quartile values of the reported phenomatch scores per case and adding up their dosage sensitivity and disrupted regulatory interaction data, we consistently ranked the reported pathogenic and likely pathogenic genes in the upper decile for 52 out of the 57 control DGAP cases (~91%) when considering candidates within the TAD and +-1 Mb analysis windows (Table S17). 32 of these genes were the top-ranking candidates in their corresponding DGAP case, while 19 of them were positioned in the second-tier rank. Only five genes could not be found in the top decile ranking positions as they had one or no lines of evidence supporting their inclusion.
Applying this ranking strategy to the 17 non-coding BCAs, we predict 16 top-ranking candidates for 11 DGAP cases and 102 second-tier candidates for the 17 analyzed DGAP cases within +-1 Mb analysis windows (Table 4.1 and Table S15). This is a significant reduction compared to the initial 645 possible candidates (~3.8% of the neighboring genes in the +-3 Mb windows considering top and second-tier candidates, and only 0.05% considering top candidates only). Of note, only nine of the 16 top-ranking candidates are included within the same TAD as the BCA breakpoint (H1-hESC TADs from (Dixon et al. 2012)), while the rest are located farther away. Nine top-ranking genes had an HI score <10%,(Huang et al. 2010) while ClinGen HI data revealed that four of these 16 genes are associated with autosomal recessive phenotypes, and an additional seven have sufficient or some evidence for haploinsufficiency. Only one candidate gene for DGAP138, glutamate ionotropic receptor kainate type subunit 2 (GRIK2 [MIM: 138244]) was a confirmed triplosensitive annotated gene in ClinGen (Table S15).
Taken together, these cases represent more plausible candidates in the search for position effect genes with functional consequences in the subjects’ phenotypes. Examples include GRIK2 which could explain the intellectual disability observed in DGAP138; SOS1, forkhead box G1 (FOXG1 [MIM: 164874]) and cochlin (COCH [MIM: 603196]) may be related to the neurological and developmental delay as well as hearing loss of DGAP163; acyl-CoA synthetase long-chain family member 4 (ACSL4 [MIM: 300157]) and POU3F4 could be involved in DGAP176’s cognitive impairment and hearing loss; SATB homeobox 2 (SATB2 [MIM: 608148]) may underlie the delayed speech and language development observed in DGAP249; RB binding protein 8 endonuclease (RBBP8 [MIM: 604124]) may be involved in DGAP252’s craniofacial dysmorphic features; SOX9 most likely explains the cleft palate observed in DGAP288; DNA polymerase epsilon catalytic subunit (POLE [MIM: 174762]) may contribute to the extreme short stature observed in DGAP275, and zinc finger E-box binding homeobox 2 (ZEB2 [MIM: 605802]) can potentially explain the hypotonia and neurological features observed in DGAP329. SOX9 had been previously proposed to explain DGAP288’s phenotype, and as predicted by our method, a decrease in its expression was observed in RNA derived from DGAP288’s umbilical cord blood.(Ordulu et al. 2016) Additional quantitative real-time PCR analyses revealed SOS1 as having reduced expression in DGAP163-derived LCLs compared to three normal sex-matched controls (Figure 4.2).Expression assessment for second-tier candidates PAK3, MID2 and POU3F4 in DGAP176 LCLs did not deviate substantially from their control expression values (Figure C.1); further searches into the Genotype-Tissue Expression (GTEx) project(Lonsdale et al. 2013) reveal that PAK3, MID2 and POU3F4 have low expression in LCLs, which would have made assessing changes in expression of these genes technically difficult. This points to the importance of the availability of tissues and cell lines relevant to the studied phenotypes, or the capacity to generate animal models that reproduce the observed BCAs for further analysis.
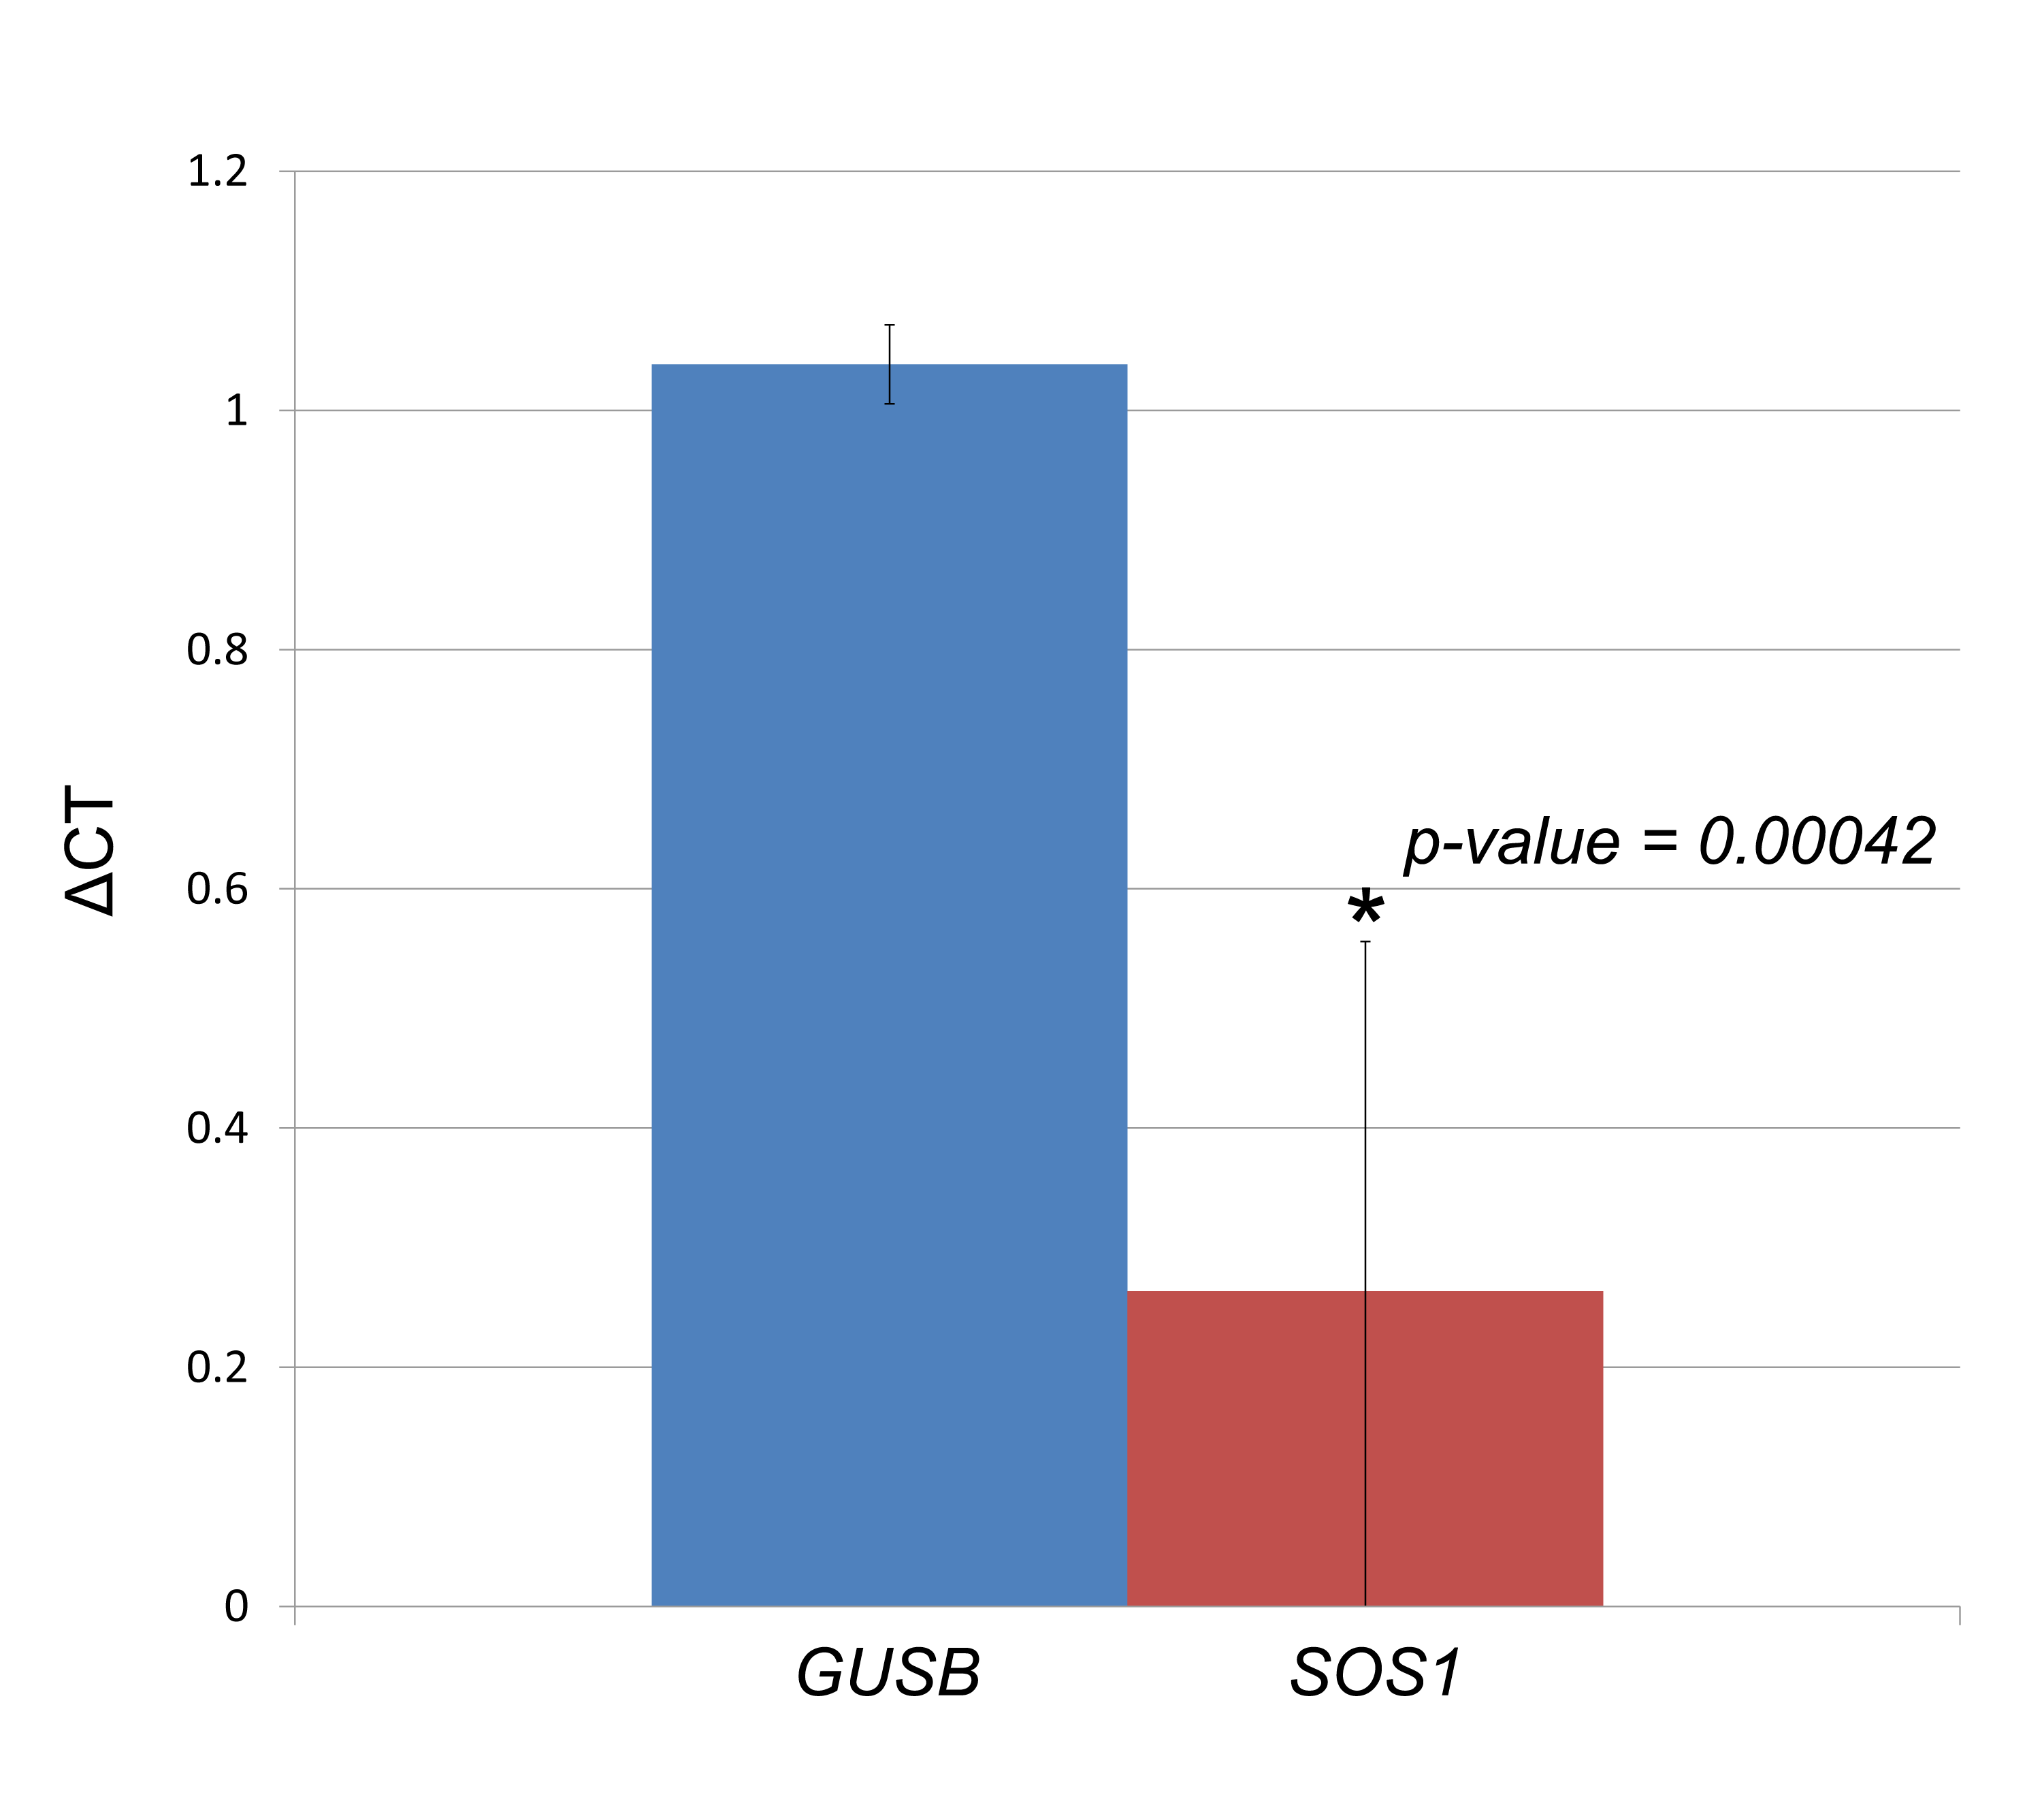
Figure 4.2: Assessment of gene expression changes for DGAP163-derived LCLs. Each column represents the ΔCT results of three culture replicates, with four technical replicates each, compared to three sex-matched control cell lines. Error bars indicate the standard deviation calculated from the biological replicates. The Mann-Whitney U test p-value is provided for the comparison between expression values of SOS1 and the control GUSB.