D.2 Supplementary Figures
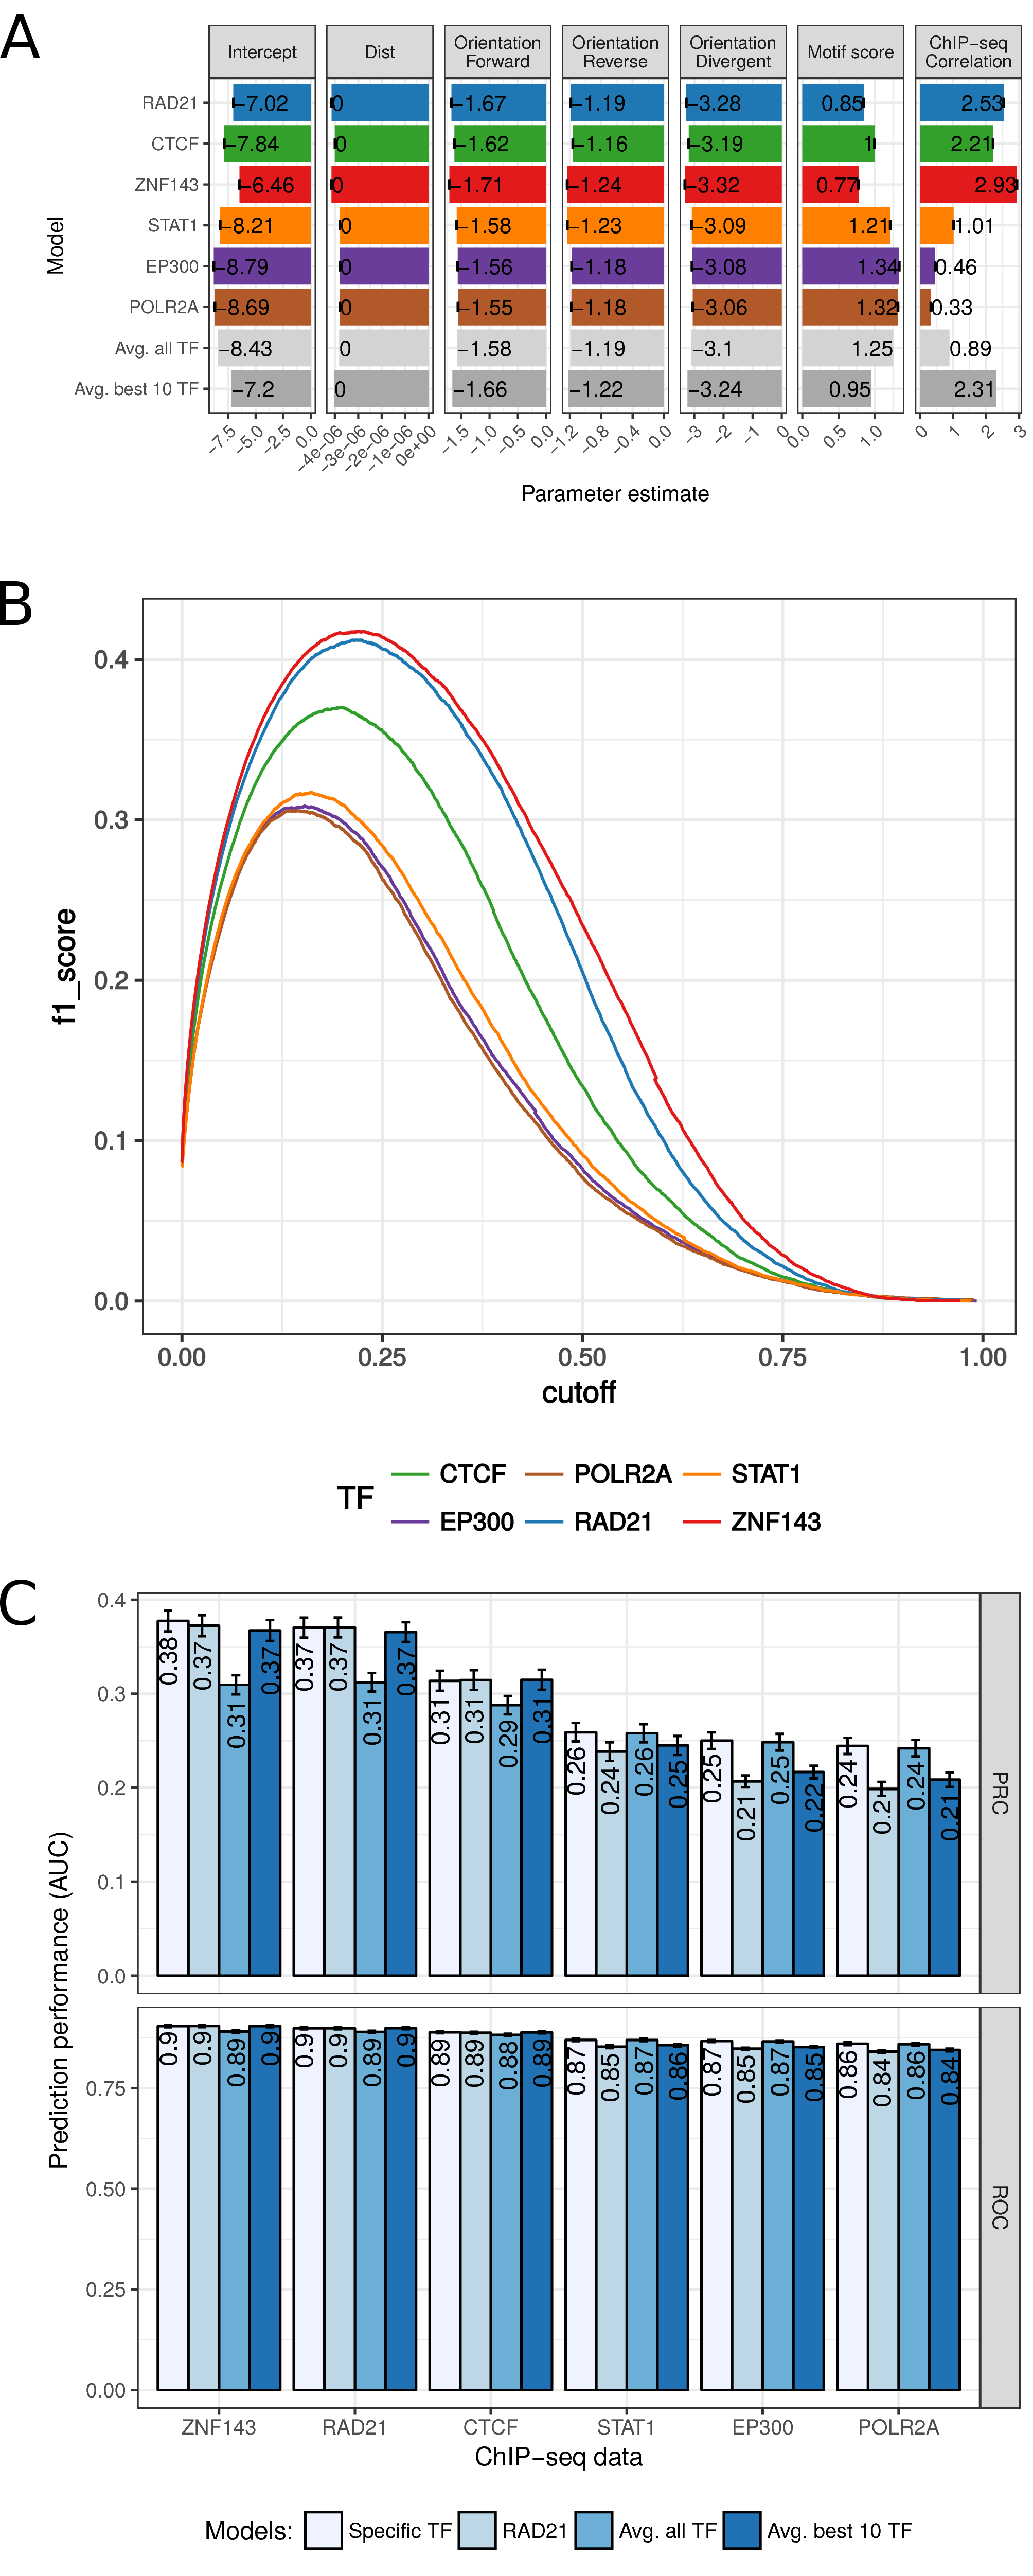
Figure D.1: 7C model parameters and optimal cut-offs for binary prediction. (A) Parameter values of the logistic regression model in 7C for different features (columns), separated for different models (rows). Average of model parameters of model training in 10-fold cross-validation is shown with error bars indicating the standard deviations. While the first six rows represent the models with the indicated TF ChIP-seq data and the genomic features, “Avg. all TF” is the average across all 124 TFs analyzed and “Avg. best 10 TF” is the average across the best ten performing TF models. (B) Prediction performance as f1 score (y-axis) for different cutoffs on the prediction probability p for the six selected models. (C) Prediction performance as auPRC (top) and auROC (bottom) of four different models (colors) on ChIP-seq data for six selected TFs (x-axis). ‘Specific TF’ is the model fitted using the ChIP-seq data indicated on the x-axis, ‘RAD21’ is the model trained on RAD21 ChIP-seq data, ‘Avg. all TF’ is a model averaged across all 124 models of analyzed TFs, and ‘Avg. best 10 TF’ is the averaged model across the 10 best performing models.