1.4 Hierarchy of chromatin 3D structure
The three-dimensional organization of genome folding was studied extensively in recent years and is reviewed comprehensively (Pombo and Dillon 2015; Sexton and Cavalli 2015; Bouwman and Laat 2015; Dekker and Mirny 2016; Dixon et al. 2016; Schmitt et al. 2016; Bonev and Cavalli 2016; Hnisz et al. 2016a; Merkenschlager and Nora 2016; Long et al. 2016; Rowley and Corces 2016; Ruiz-Velasco and Zaugg 2017; Andrey and Mundlos 2017).
The genome is thought to be hierarchically organized on different genomic-length scales (Fig. 1.3). Whole chromosomes occupy distinct territories in the nucleus. Thereby, chromatin clusters in two types of compartments on the Mb scale. On the sub-Mb scale, pair-wise interactions are enriched in discrete domains and sub-domains. These domains are made up of individual looping interactions and restrict regulatory contacts between enhancers and gene promoters. These hierarchical levels are described below in more detail.
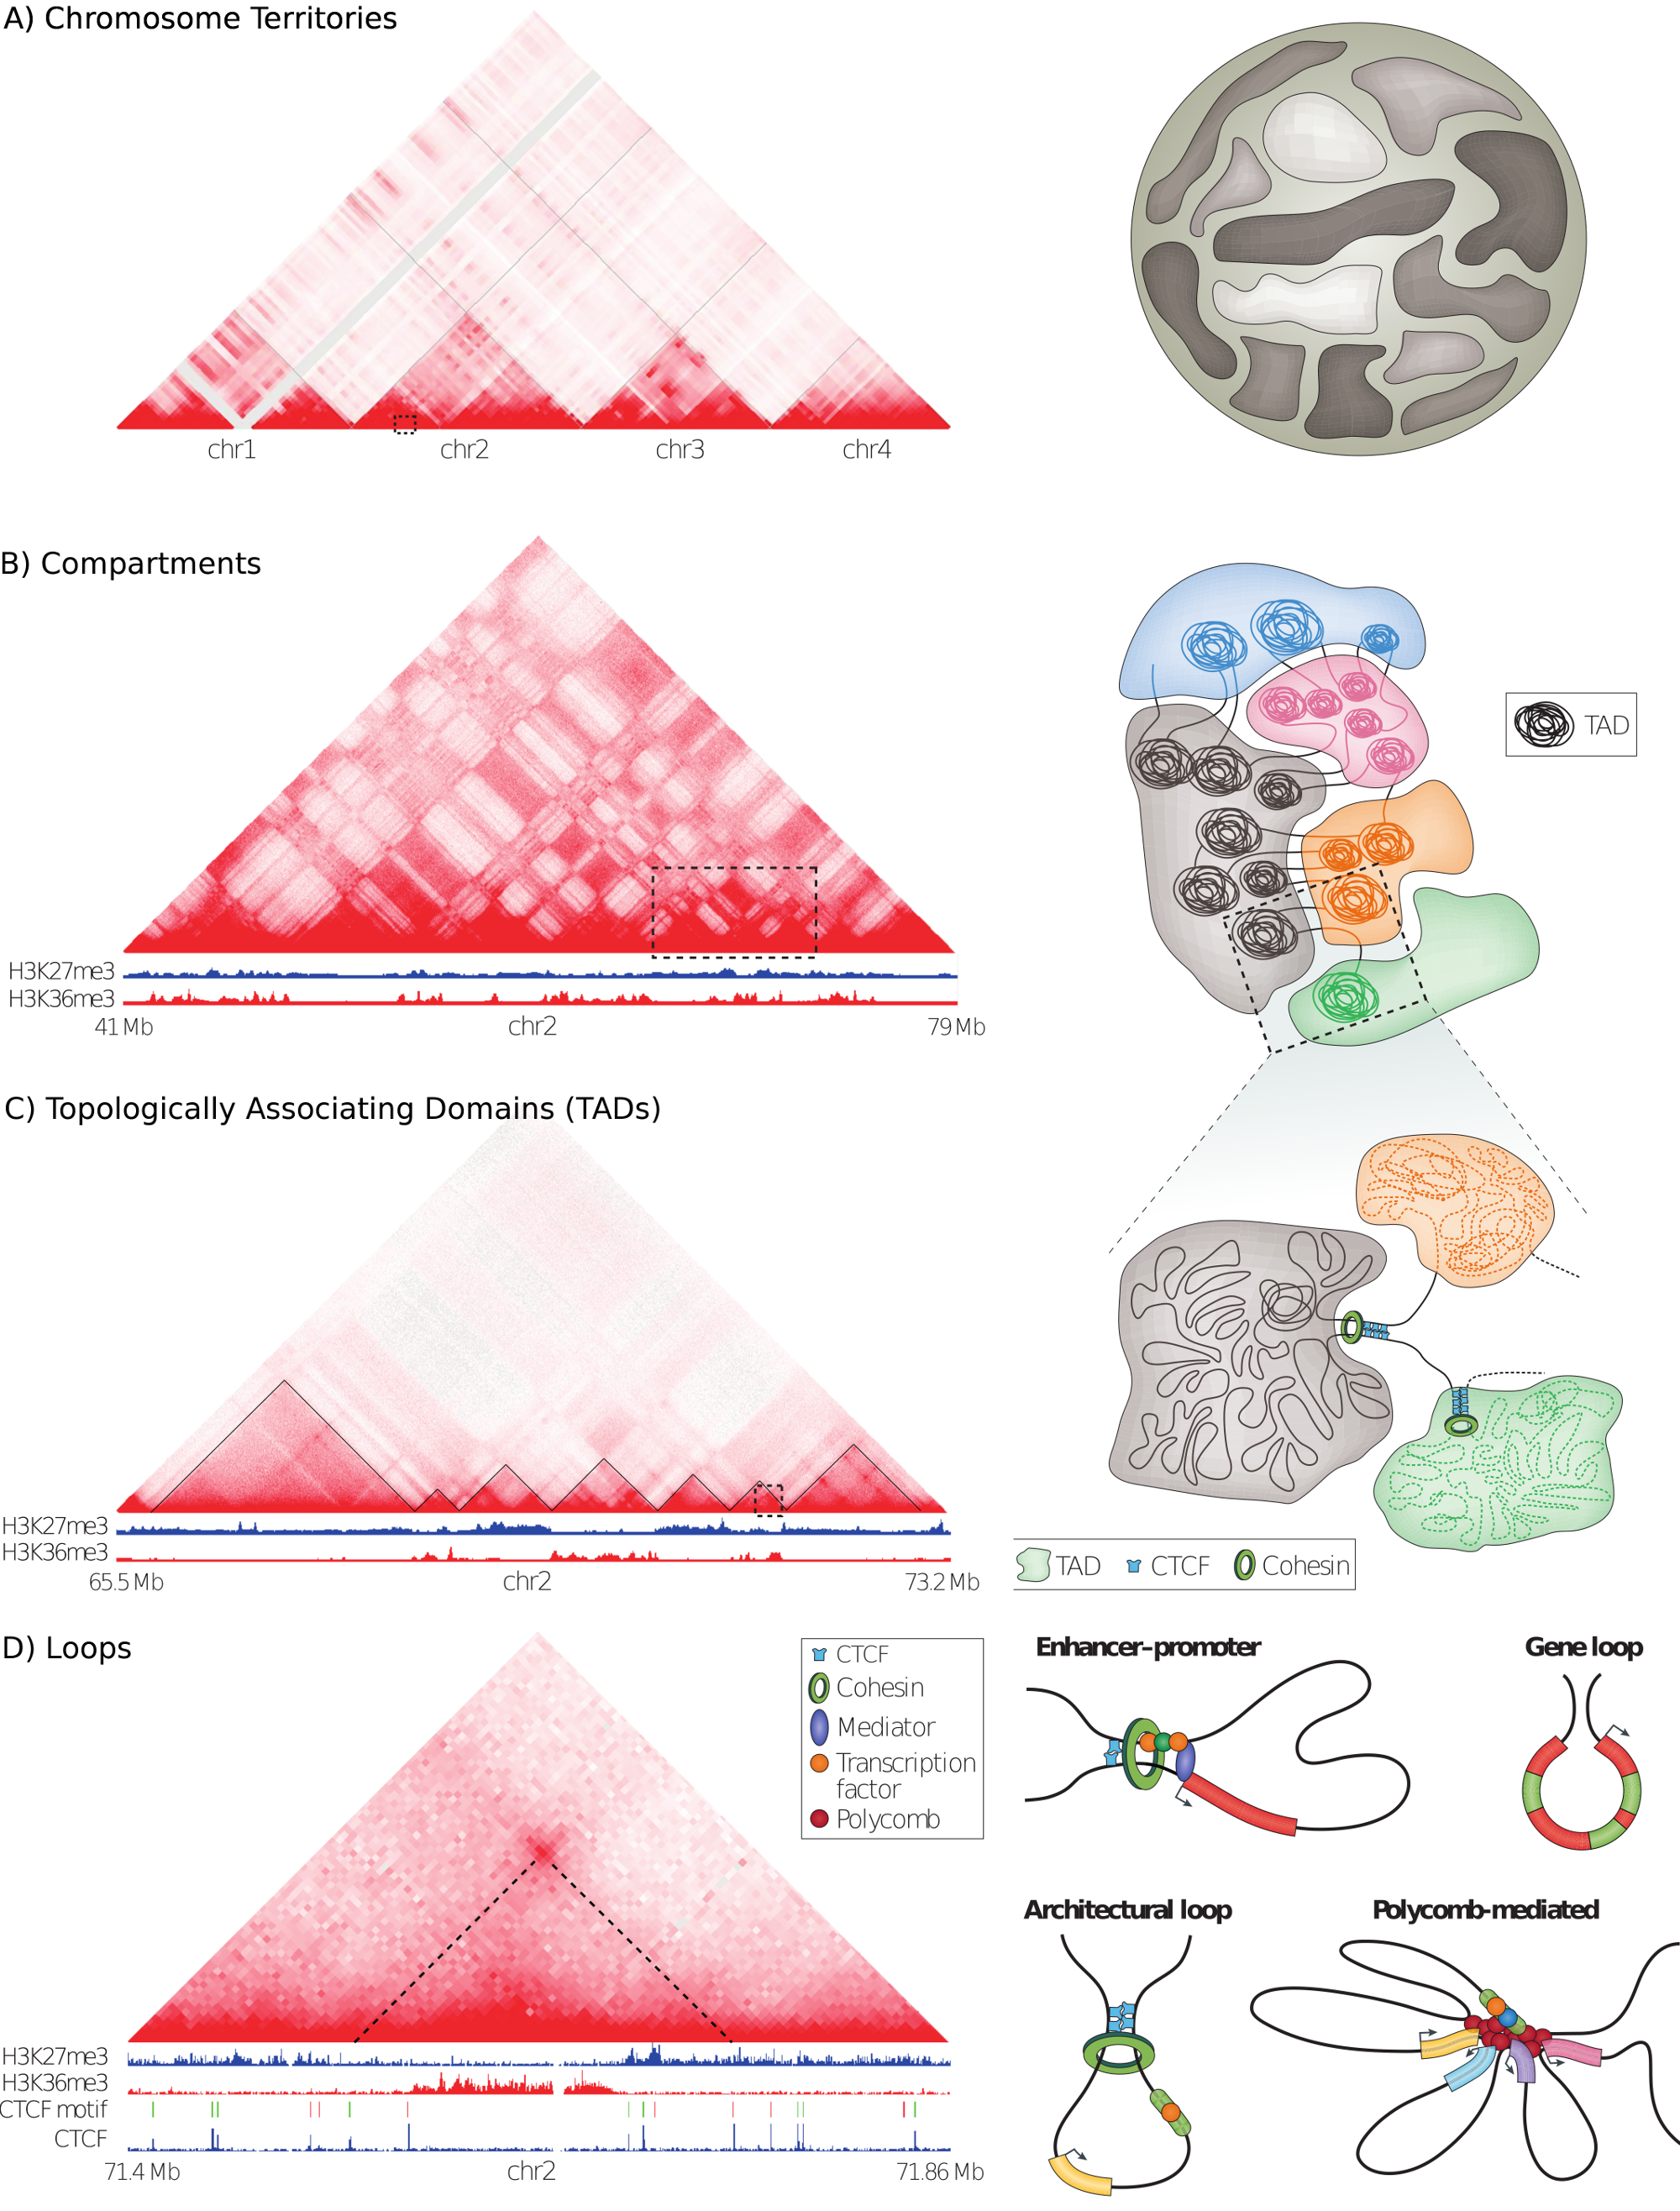
Figure 1.3: Hierarchical organization of three-dimensional chromatin architecture. The left side shows a high-resolution Hi-C interaction map as a heat-map. The color intensity represents the interaction frequencies of orthogonally associated loci. The right side shows models of the individual genome structures. (A) Interactions occur mostly between loci on the same chromosome, indicating chromosome territories. (B) Alternating patterns of interaction clusters show the association of chromatin into A/B compartments. (C) TADs appear as triangles with enrichment for intra-TAD interactions. Borders of TADs insulate interactions between neighboring domains. (D) Peaks in the Hi-C heat-map indicate pair-wise chromatin looping interactions of the associated loci. Several types of loops are shown on the right side. Figure adapted from (Bonev and Cavalli 2016).
1.4.1 Chromosomal territories and inter-chromosomal contacts
The eukaryotic genome is highly organized in the interphase nucleus. Chromosomes occupy distinct spatial regions, called chromosome territories, and intermingle less than one would expect by chance (Fig. 1.3A) (Cremer and Cremer 2001). This was first observed using imaging-based approaches and is also reflected in Hi-C interaction maps, where inter-chromosomal contacts occur an order of magnitudes less frequent than intra-chromosomal contacts (Lieberman-Aiden et al. 2009). However, despite this spatial segregation of chromosomes, an intermingling of chromosome occurs and is associated with chromosomal translocations (Branco and Pombo 2006; Roukos et al. 2013; Roukos and Misteli 2014). There are also specific gene regulatory interactions between different chromosomes (Laat and Grosveld 2007), for example, olfactory receptor genes cluster densely in the nucleus of olfactory neurons to facilitate mono-allelic expression of a single receptor gene per cell (Monahan and Lomvardas 2015). Together, there exists only a few, but specific inter-chromosomal contacts and the genome is non-randomly organized in the interphase nucleus by chromosomes occupying distinct spatial territories.
1.4.2 A/B compartments
The ability to measure genome-wide chromatin contacts using Hi-C revealed that individual regions on chromosomes segregate by preferential interactions into two major clusters, referred to as A/B-compartments (Fig. 1.3B) (Lieberman-Aiden et al. 2009). Interestingly, regions in A-compartments are associated with active histone modifications and active transcription, whereas B-compartment is associated with heterochromatin, lamina association, and repressed genes (Bonev and Cavalli 2016). More recently, higher resolution Hi-C maps further subdivided A/B compartments into six sub-compartments with preferential interactions and associations with distinct chromatin features (Rao et al. 2014).
1.4.3 Topologically associating domains (TADs)
Compartments could be identified by clustering of long-range interactions in Hi-C maps with bin resolution of 1 Mb. In 2012, higher resolution Hi-C maps of up to 40 kb lead to the identification of genomic regions with preferential interactions within them (Fig. 1.3C). These genomic regions were termed topologically associating domains (TADs) (Dixon et al. 2012; Nora et al. 2012; Sexton et al. 2012). Other authors describe similar structures as physical domains, chromatin domains, or contact domains. TADs are operationally defined as genomic regions with frequent interactions of loci within the domain and decreased interactions across domain boundaries. Quantitatively, Hi-C contact frequencies between loci in the same TAD are approximately two to three times those of genomic regions outside of the TAD (Merkenschlager and Nora 2016).
TADs can be identified from Hi-C interaction maps computationally by different algorithms (Ay and Noble 2015). The directionality index (DI) is a score for each bin in the Hi-C matrix that quantifies the number of upstream versus downstream interactions of this bin. Using hidden Markov models, TAD boundaries where then identified in regions where DI changes drastically (Dixon et al. 2012). Other algorithms compute an insulation score as the extent to which interactions cross potential TAD boundaries (Crane et al. 2015). Later, the Arrowhead algorithm was introduced to find “contact domains” as smaller nested structures along the diagonal of high-resolution Hi-C matrices (Rao et al. 2014). Furthermore, when analyzing Hi-C interactions at different length scales, hierarchies of TADs and sub-TADs could be identified that overlap each other (Filippova et al. 2014; Fraser et al. 2015). The different algorithms and parameters used in each study is only one source of variation in reliably identifying TADs. Othe sources of variations are (i) the resolution of Hi-C maps, which is mainly defined by sequencing depths, (ii) the individual steps in Hi-C protocols, such as the restriction enzyme used, (Rao et al. 2014), and (iii) different normalization strategies for raw Hi-C contact frequencies (Dali and Blanchette 2016; Forcato et al. 2017). Therefore, the number and size of TADs vary between different studies, making it difficult to compare TADs in different conditions and species across studies.
The first studies on TADs identified around 3,000 TADs with a median size of ~800 kb in human and mouse genomes (Dixon et al. 2012) and around 1,200 physical domains of about 100 kb in Drosophila genomes (Sexton et al. 2012). Analysis of 1kb or 5kb resolution Hi-C matrices resulted in nested contact domains with a median size of 185 kb (range 40 kb - 3 Mb) in human and mouse cells (Rao et al. 2014). Interestingly, TADs might be equivalent to chromatin domains of 10 kb - 1 Mb in size detected by microscopy approaches (Cremer and Cremer 2010; Gibcus and Dekker 2013). Another connection of Hi-C derived interaction maps with previous microscopy observations, is that TADs in Drosophila correspond to bands of polytene chromosomes (Eagen et al. 2015). Importantly, domain structures, like TADs, were also identified using methods that do not use chromatin cross-linking and proximity-ligation. Labeling approaches using oligoprobes enabled to trace the position of TADs along individual chromosomes (Wang et al. 2016). Furthermore, domain organization in TADs was confirmed by a recently developed genome architecture mapping (GAM) approach, which relies on DNA sequencing from a collection of thin nuclear sections (Beagrie et al. 2017).
The spatial positioning of TADs correlates with many genomic features measured along the linear genome (Merkenschlager and Nora 2016). TAD boundaries are enriched for binding of insulator proteins, such as CTCF in mammals and CP190 in Drosophila (Dixon et al. 2012; Sexton et al. 2012). Furthermore, TAD boundaries are associated with active chromatin, such as H3K4me3 and H3K27me3, DNase I hypersensitivity, active transcription, short interspersed nuclear elements (SINEs), and house-keeping genes (Dixon et al. 2012). Furthermore, TADs correspond to regions of early and late replication timing (Pope et al. 2014; Dileep et al. 2015) and lamina-associated domains (LADs) (Dixon et al. 2012). Importantly, enhancer-promoter interactions seem to be mostly constrained within TADs (Shen et al. 2012; Ghavi-Helm et al. 2014; Symmons et al. 2014), and initial studies report slightly increased co-expression of genes within the same TAD (Nora et al. 2012).
Altogether, there is accumulating evidence that TADs are fundamental units of chromosome organization (Dixon et al. 2016)
1.4.4 Hierarchy of domain structures across genomic length scales
Globally, higher-order interactions between different TADs leads to a tree-like hierarchy of TADs and meta-TADs across genomic scales up to the range of entire chromosomes (Fraser et al. 2015). Similar to A/B-compartments, these tree structures correlate with epigenetic marks and expression changes during cell differentiation (Fraser et al. 2015).
However, TADs can also be divided further into smaller regions with stronger preferential interactions within them. These are often referred to as sub-TADs (Phillips-Cremins et al. 2013) and might correspond to contact domains which were later identified using high-resolution Hi-C (Rao et al. 2014). While sub-TADs display the same self-association features as TADs with decreased contact frequencies across sub-TAD boundaries, sub-TADs seems to be less stable across different cell types and tissues and are stronger related to tissue-specific gene expression (Berlivet et al. 2013; Phillips-Cremins et al. 2013). Studies of CTCF and cohesin mediated interactions using ChIA-PET identified smaller structural units within TADs (Dowen et al. 2014). Chromatin loops anchored at CTCF and cohesin binding sites span genomic regions described as insulated neighborhoods that restrict enhancer-promoter interactions (Hnisz et al. 2016a). Furthermore, perturbations of anchor regions by naturally occurring or experimentally induced mutations lead to dysregulation of enclosed genes (Dowen et al. 2014; Hnisz et al. 2016b; Ji et al. 2016). In summary, segregation of chromosomes into domain-like structures seems to follow a hierarchical organization across genomic-length scales. Accordingly, interaction clustering appears at scales of A/-B compartments or meta-TADs over TADs, contact domains, sub-TADs to individual chromatin loops.
1.4.5 Chromatin looping interactions
High-resolution proximity ligation techniques enabled to measure genome-wide pairwise interactions that interact significantly more frequently than background interactions (Fig. 1.3D). Chromatin loops can be broadly divided into two types (Yu and Ren 2017; Andrey and Mundlos 2017) The first type is constitutive or architectural loops. Constitutive loops are mostly invariant across cell types and demarcate TAD or sub-TAD boundaries (Dowen et al. 2014; Ji et al. 2016; Phillips-Cremins et al. 2013). Often, they are formed by CTCF and cohesin complexes (Rao et al. 2014).
High-resolution Hi-C data showed that around 80% of borders of contact domains interact each other as loop anchors (Rao et al. 2014). This indicating that TADs form through loops between their borders and eventually several further nested loops within them.
An intrinsic feature of vertebrate genomes is a comparatively long distance between regulatory regions, such as enhancers, and their regulated genes. For their ability to function as transcriptional regulators, enhancers need to come into close spatial proximity with their target promoter. These regulatory interactions are facilitated by the second type of chromatin loops, facultative loops. These loops are more cell type-specific and represent enhancer-promoter interactions. For example, the enhancers of the \(\beta\)-globin gene interact strongly with its target gene via long-range chromatin contacts in erythroid cells where the \(\beta\)-globin gene is active but shows little or no interactions in cells from different lineages (Palstra et al. 2003). Notably, such regulatory interactions of facultative loops appear mostly within regions spanned by consecutive loops or TADs (Hnisz et al. 2016a).
1.4.6 TAD and loop formation by architectural proteins
An important question in current research efforts is to understand how TADs and chromatin loops are established on a molecular level. These mechanisms might differ between species. Several, so-called, architectural proteins are enriched at TAD boundaries in flies and allow dynamic regulation of these boundaries (Van Bortle et al. 2014; Gómez-Díaz and Corces 2014). In vertebrates, only some of these proteins are conserved, indicating a partially different set of factors with such functions (Phillips-Cremins et al. 2013; Bonev and Cavalli 2016). Profiling 76 TFs for binding signals at strong chromatin loop anchors identified CTCF, subunits of the cohesin complex, ying yang 1 (YY1) and zinc finger protein 143 (ZNF143) as highly enriched (Rao et al. 2014). Furthermore, the mediator complex has a well-characterized role in bridging enhancer and promoters of long-range distances and assemble the pre-initiation complex for transcriptional elongation (Allen and Taatjes 2015). Mediator depletion resulted in diminished looping interaction strength (Bonev and Cavalli 2016).
Cohesin is a ring-shaped protein and has several functions including sister chromatid cohesion and DNA repair and interacts with mediator complex and CTCF in the context of chromatin architecture (Bonev and Cavalli 2016; Merkenschlager and Nora 2016). Initial studies analzed chromatin organization in cohesin deficient cells. In two studies depletion of cohesin reduced interactions within TADs but did not alter TAD structures completely (Seitan et al. 2013; Zuin et al. 2014). One study report a significant increase in interactions between different TADs after cohesin depletion (Sofueva et al. 2013). Conditional deletion of cohesin in non-cycling thymocytes suggested a role of cohesin in mediating regulatory interactions between enhancers within TADs (Ing-Simmons et al. 2015).
The best studied architectural protein is probably CTCF (Ong and Corces 2014). CTCF is conserved in most bilaterians, expressed in all tissues, and essential for embryonic development. By its ability to restrict promoter-enhancer interaction in reporter plasmids, CTCF was characterized as insulator protein. CTCF has 11 zinc finger binding domains which recognize a specific DNA sequence motif, to which CTCF binds with high affinity (Kim et al. 2007; Nagy et al. 2016). CTCF binding sites are enriched at TAD boundaries in Drosophila and mammals. However, only around 15% of CTCF binding sites are located at TAD boundaries, suggesting that CTCF binding not be sufficient for TAD formation (Bonev and Cavalli 2016). About 30% to 60% of CTCF binding sites are cell-type specific, and many variable sites show an association of DNA methylation with CTCF binding. CTCF binding sites that depend on methylation are located mostly within TADs. Interestingly, CTCF ChIP-seq data across individuals show a higher variability of CTCF binding within TADs and lower variation at TAD boundaries (Ruiz-Velasco and Zaugg 2017). Also, evolutionary conservation of CTCF binding across species is stronger at TAD boundaries (Vietri Rudan et al. 2015). Depletion of CTCF had a similar effect than cohesin degradation, resulting in increased inter-domains interactions (Seitan et al. 2013; Zuin et al. 2014). These data suggest a crucial role of cohesin and CTCF in promoter-enhancer interactions and TAD formation (Pombo and Dillon 2015; Merkenschlager and Nora 2016).
Interestingly, CTCF motifs appear mostly in convergent orientation at chromatin loop anchors (Rao et al. 2014; Tang et al. 2015; Vietri Rudan et al. 2015). Furthermore, experimental inversion of the motif results in changes of loop formation and, at least in some cases, altered gene expression (Guo et al. 2015; Wit et al. 2015; Sanborn et al. 2015). Polymer simulation studies together with perturbation experiments led to a model of TAD and loop formation by loop extrusion. According to this model, loop-extruding factors, such as cohesin, form progressively larger loops but stall at CTCF binding sites in convergent orientation (Sanborn et al. 2015; Fudenberg et al. 2016). Interestingly, this model explains many features of chromatin interaction data, such as the directionality of CTCF motif and nested hierarchy of TADs and TAD-like structures.
In summary, genome-wide interaction data suggest a hierarchical organization of chromosome architecture. First, dynamic nucleosome contacts form clutches and fibers. These engage in long-range chromatin loops, some of which are stabilized by architectural proteins, such as CTCF and cohesin at convergently oriented motif sites, and lead to the formation of TADs. TADs form clusters by their epigenomic type into A/B compartments, and coalescence of compartments in the same chromosome forms chromosome territories (Bonev and Cavalli 2016).