B.2 Supplementary Figures
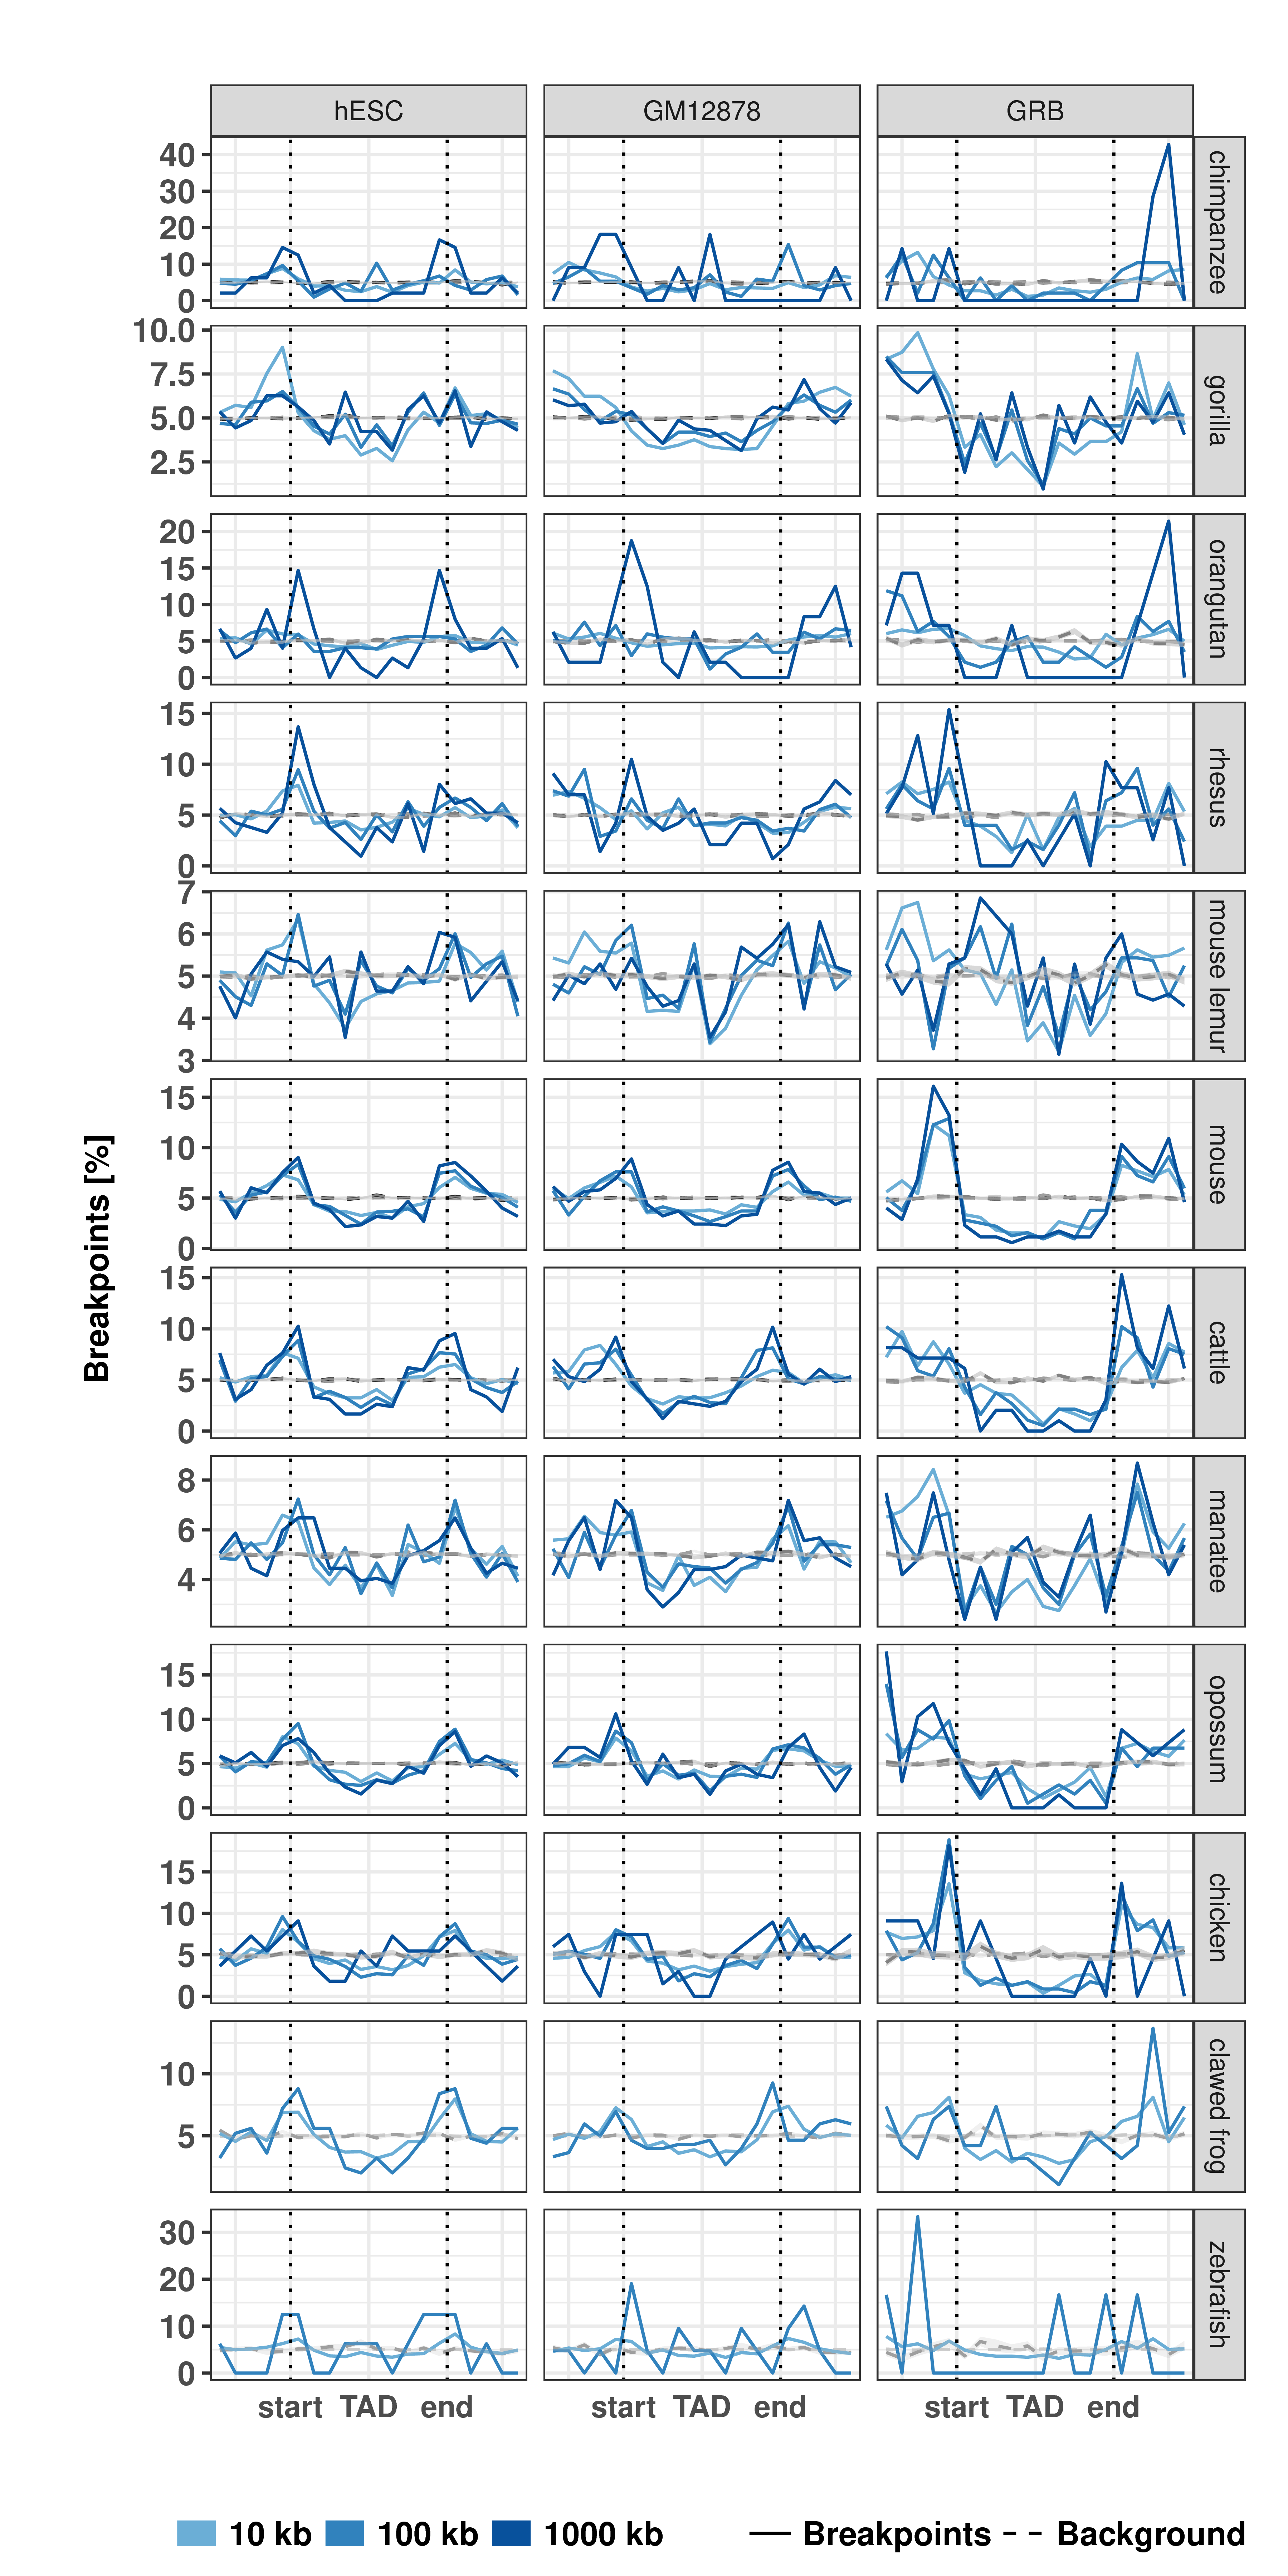
Figure B.1: Distribution of evolutionary rearrangement breakpoints between human and 12 vertebrate genomes around domains. Relative breakpoint numbers from human and different species (horizontal panels) around hESC TADs (left), GM12878 contact domains (center), and GRBs (left). Blue color scale represents breakpoints from different fill-size thresholds. Dotted lines in gray show simulated background controls of randomly placed breakpoints.
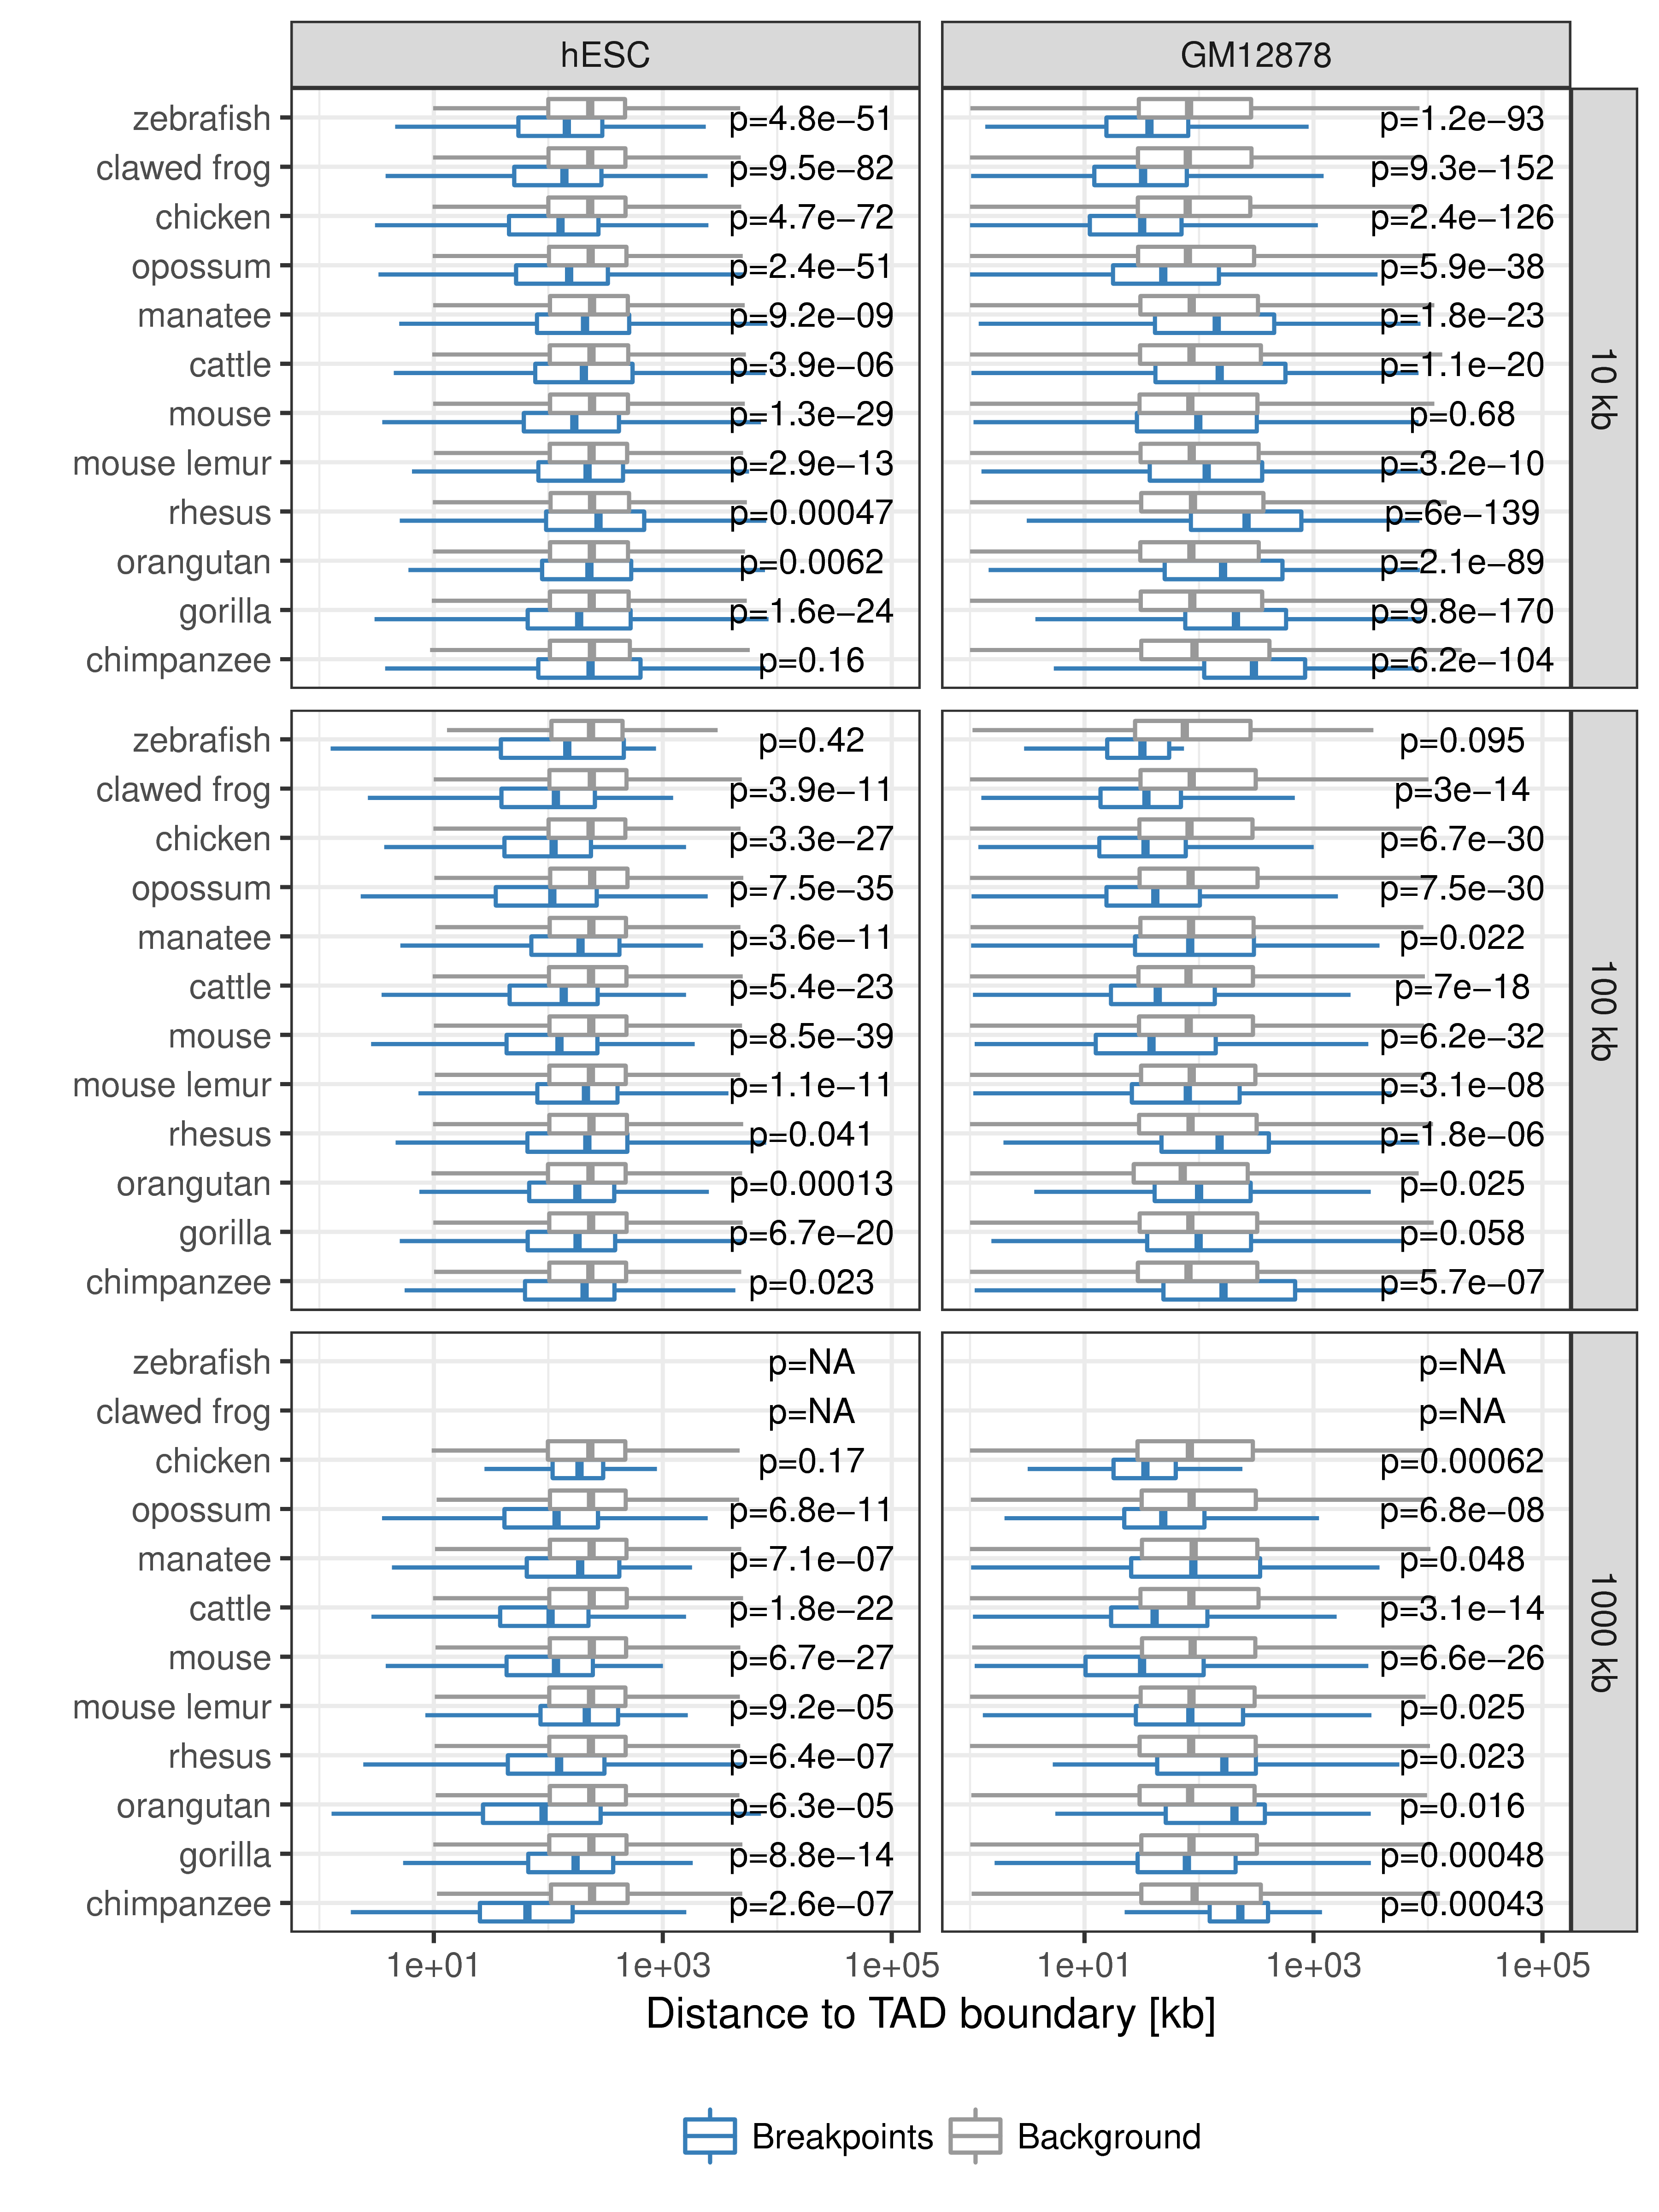
Figure B.2: Distance between rearrangement breakpoints and random controls to closest TAD boundary. For each species (y-axis) and fill size threshold (vertical panels) the distances from all identified rearrangement breakpoints to its closest TAD boundary (x-axis) are compared between actual rearrangements (blue) and 100 times randomized background controls (gray). The left panel shows distances to next hESC TAD boundary and the right panel distances to closest GM12878 contact domain boundary. P-values according to Wilcoxon’s rank-sum test.