5.1 Introduction
The three-dimensional folding structure of the genome and its dynamic changes play a very important role in the regulation of gene expression (Merkenschlager and Nora 2016; Krijger and Laat 2016). For example, while it was well known that transcription factors (TFs) can regulate genes by binding to their adjacent promoters, many TF binding sites are in distal regulatory regions, such as enhancers, that are hundreds of kilo bases far from gene promoters (Spitz and Furlong 2012). These distal regulatory regions can physically interact with promoters of regulated genes by chromatin looping interactions (Tolhuis et al. 2002; Sanyal et al. 2012), thus it is not trivial to associate TFs to regulated genes without information of the genome structure (Mora et al. 2015). Such looping interactions can be measured by chromosome conformation capture (3C) experiments (Dekker et al. 2002) and its variations to either study all interactions from single targeted regions (4C) (Simonis et al. 2006) or multiple target regions (5C) (Dostie et al. 2006), interactions between all regions genome-wide (Hi-C) (Lieberman-Aiden et al. 2009; Rao et al. 2014) or interactions mediated by specific proteins (6C (Tiwari et al. 2008) and ChIA-PET (Fullwood et al. 2009; Tang et al. 2015)).
While these experimental methods have brought many exciting insights into the three-dimensional organization of genomes (Merkenschlager and Nora 2016; Krijger and Laat 2016; Bonev and Cavalli 2016), these methods are not only elaborate and expensive but also require large amounts of sample material or have limited resolution (Sati and Cavalli 2016; Schmitt et al. 2016). As a consequence, genome-wide chromatin interaction maps are only available for a limited number of cell types and conditions.
In contrast, the binding sites of TFs can be detected genome-wide by ChIP-seq experiments, and are available for hundreds of TFs in many cell types and conditions (Dunham et al. 2012; Davis et al. 2017). Here, we propose that it is possible to use these data to detect chromatin loops.
Recent studies provide functional insights about how chromatin loops are formed and highlight the role of architectural proteins such as CTCF and cohesin (Merkenschlager and Nora 2016). CTCF recognizes a specific sequence motif, to which it binds with high affinity (Kim et al. 2007; Nagy et al. 2016). Interestingly, CTCF motifs are present in convergent orientation at chromatin loop anchors (Rao et al. 2014; Tang et al. 2015; Vietri Rudan et al. 2015). Furthermore, experimental inversion of the motif results in changes of loop formation and altered gene expression (Guo et al. 2015; Wit et al. 2015). Polymer simulations and experimental perturbations led to a model of loop extrusion, in which loop-extruding factors, such as cohesin, form progressively larger loops but stall at CTCF binding sites in convergent orientation (Sanborn et al. 2015; Fudenberg et al. 2016). According to these models, CTCF binding sites can function as anchors of chromatin loops.
Our hypothesis is, that we can use convergently aligned CTCF motifs to search for similar ChIP-seq signals at both sites of chromatin loops to predict looping interactions from the largely available ChIP-seq data in many diverse cell-types and conditions (Fig. 5.1A). We then developed and tested a computational method to predict chromatin looping interactions from only genomic sequence features and TF binding data from ChIP-seq experiments. We show that our method has high prediction performance when compared to Hi-C and ChIA-PET loops and that prediction performance depends on the ChIP-seq target, which allows screening for TFs with potential novel functions in chromatin loop formation. The predicted looping interactions can be used to (i) associate TF binding sites or enhancers to regulated genes for conditions where Hi-C like data is not available, and (ii) to increase the resolution of interaction maps, where low resolution Hi-C data is available. We implemented our method as the R package sevenC.
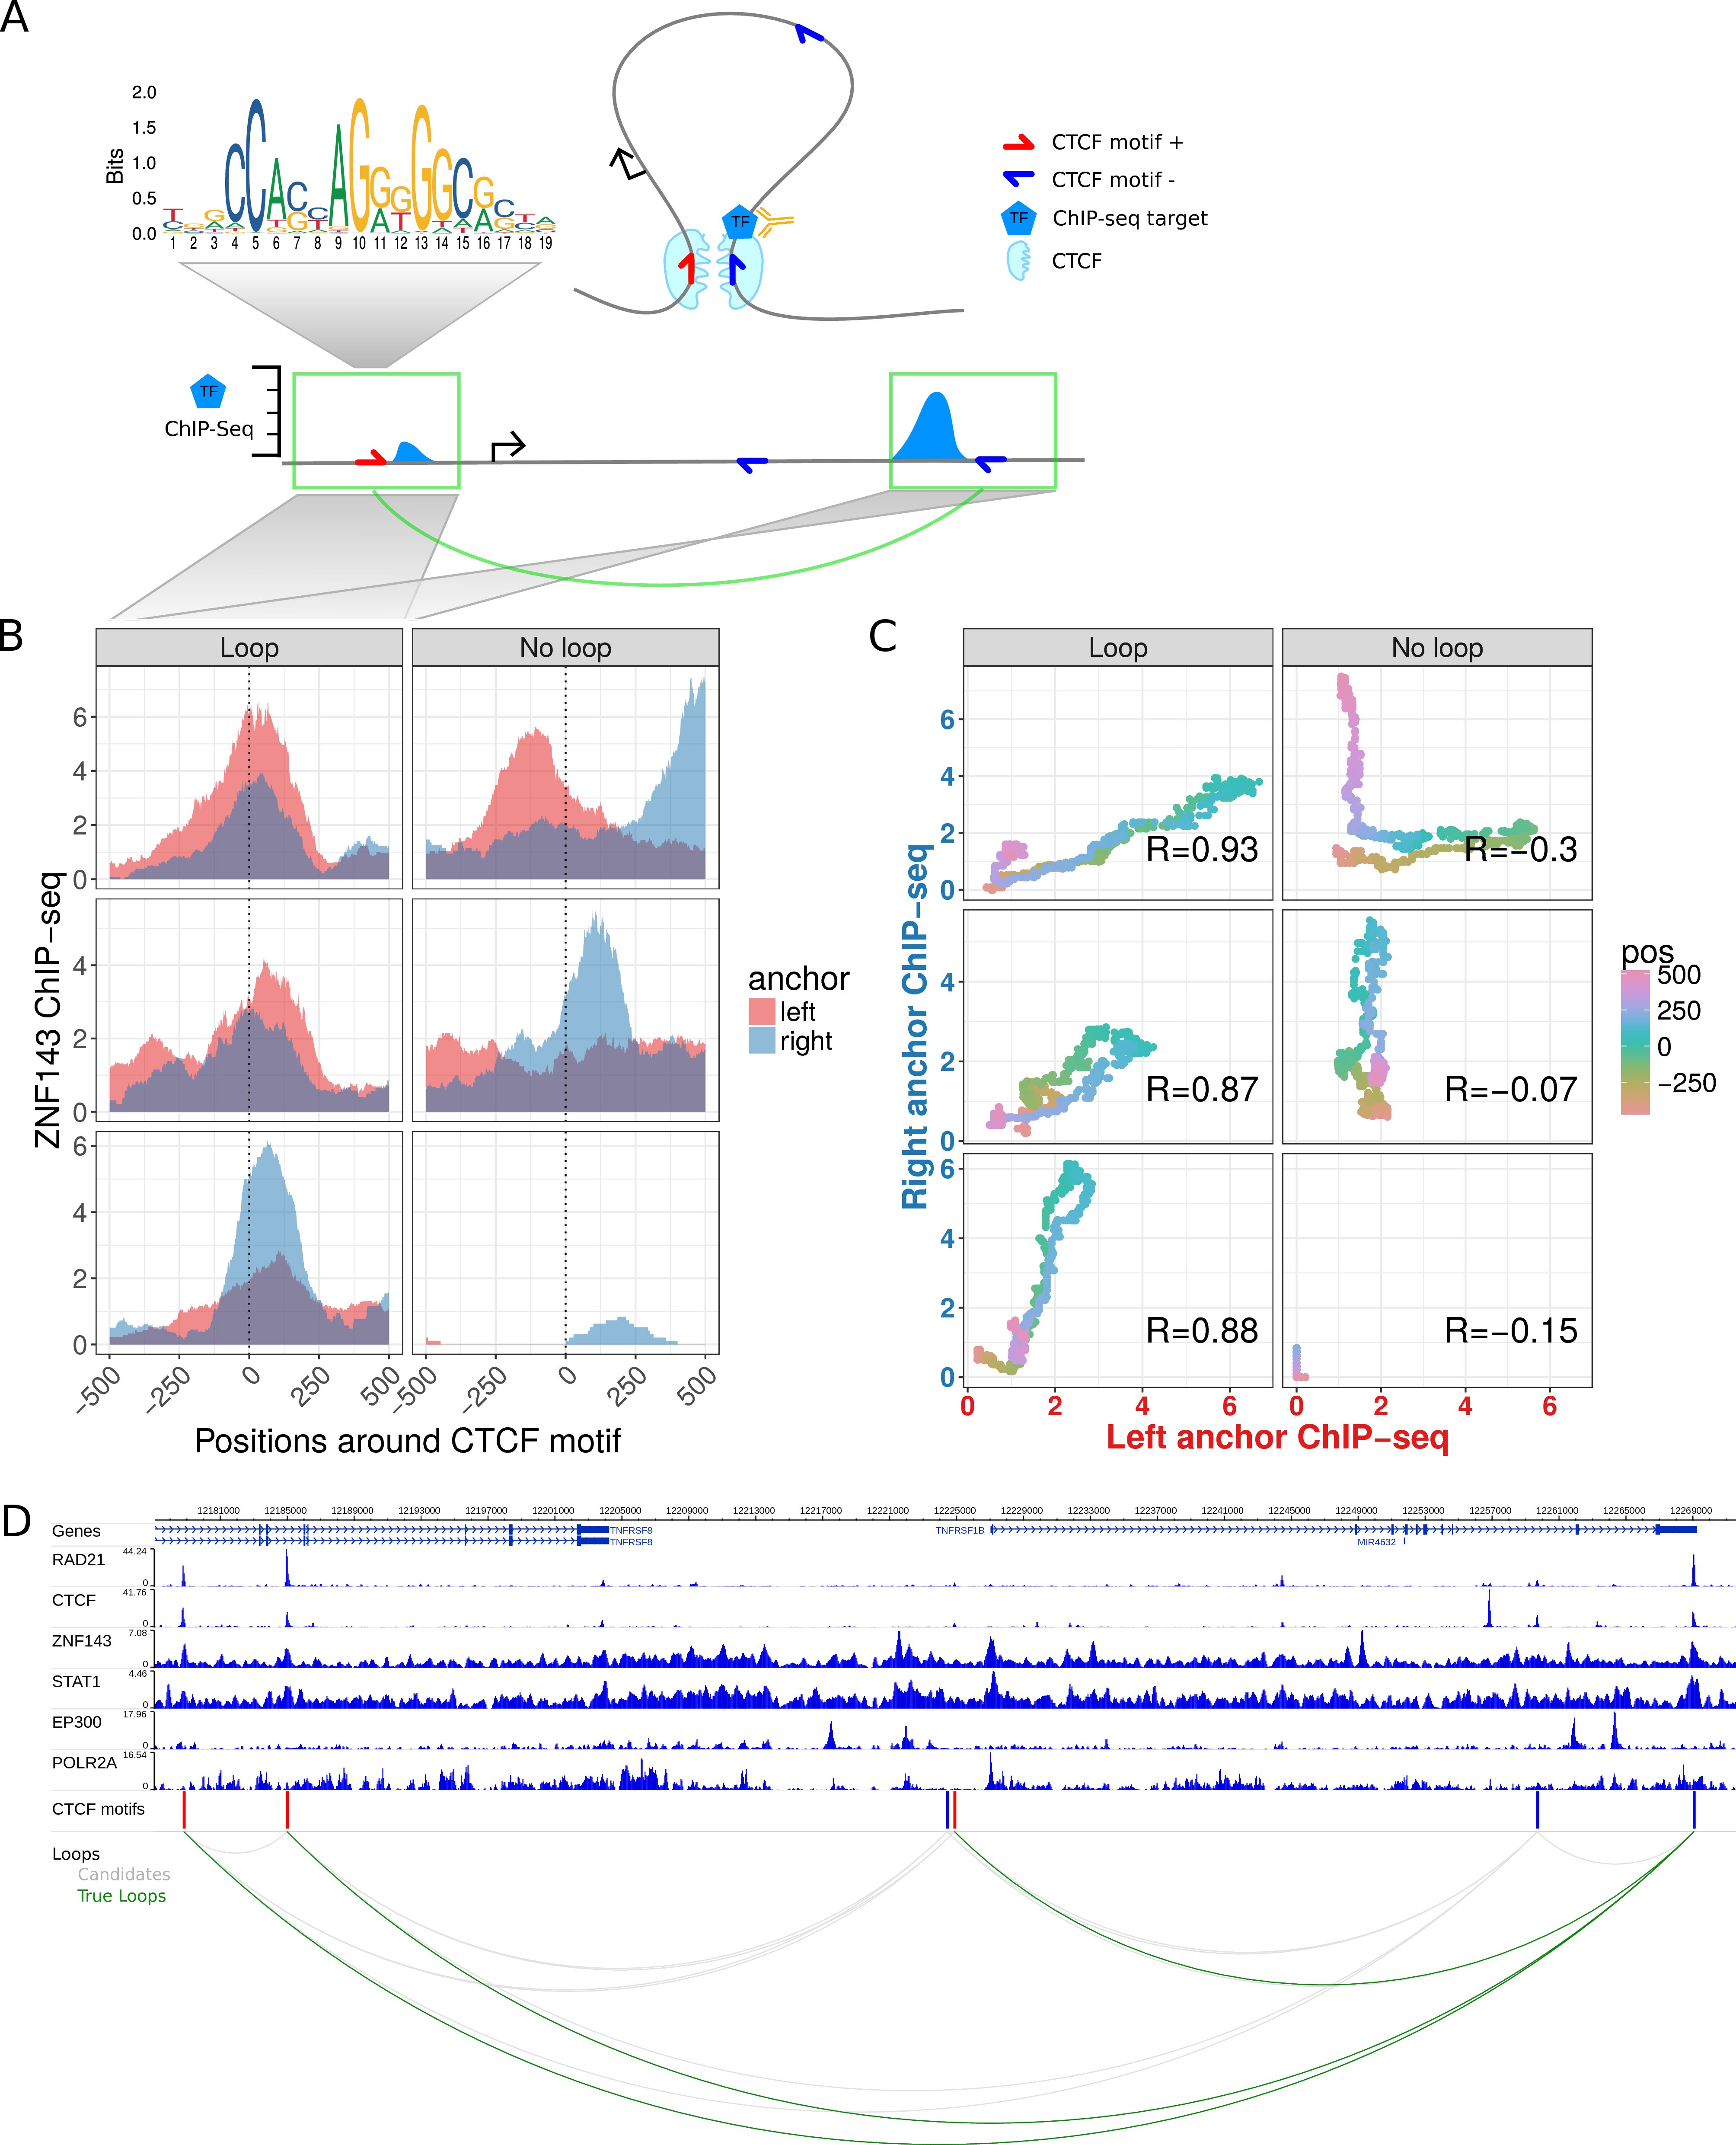
Figure 5.1: Chromatin looping interactions result in ChIP-seq coverage signals at direct and indirect bound loop anchors. (A) Schematic illustration of a chromatin loop with CTCF motifs at the loop anchors (top right). A TF binds directly at the right loop anchor close to the CTCF motif. This results in a ChIP-seq coverage peak at the directly bound locus (bottom right) and in a minor signal at the other loop anchor (bottom left), both at the same distance to each CTCF motif. (B) Znf143 ChIP-seq coverage at six selected example CTCF motif pairs of which the ones in the left panel interact via loops according to Hi-C and ChIA-PET data and the ones in the right panel do not interact. The ChIP-seq coverage signal for each loci pair is shown in red for the left anchor region and in blue for the right anchor region, according to the distance to the CTCF motif (x-axis). Interacting CTCF motif pairs show more similar ChIP-seq coverage signals, which are often enriched at similar distances to the CTCF motif pairs, while the profiles of non-interacting pairs are less similar. (C) The similarity of ChIP-seq profiles by correlation of the ChIP-seq coverage signals of the selected motif pairs in (B). For each pair, the coverage at the right anchor is plotted versus the coverage at the left anchor at the same distance (color coded) from each CTCF motif. The Pearson correlation coefficient (R) of the dots is higher for interacting loci pairs. (D) Example loci on chromosome 1 shown in the genome-browser with six ChIP-seq tracks. Red and blue bars indicate CTCF recognition motifs on the forward and reverse strand, respectively. The bottom panel shows CTCF motif pairs in gray (candidates) and actually interacting pairs in green, according to ChIA-PET and Hi-C data.